
Here are my top 5 charting hacks that have saved me a ton of time. They are incredibly simple and equally powerful!
1. Create a Chart in a Single Key Stroke
So if you have some data for which you want to make a chart
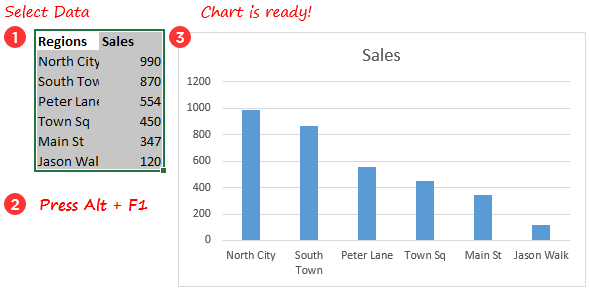
Do this
- Select the data
- Press Alt + F1
- Chart is Ready
2. Change the default Chart Type
As of now each time you select the data and press ALT + F1 a standard column chart is made but what if you wanted to make some line charts instead. No worries change the default chart type to a line chart.
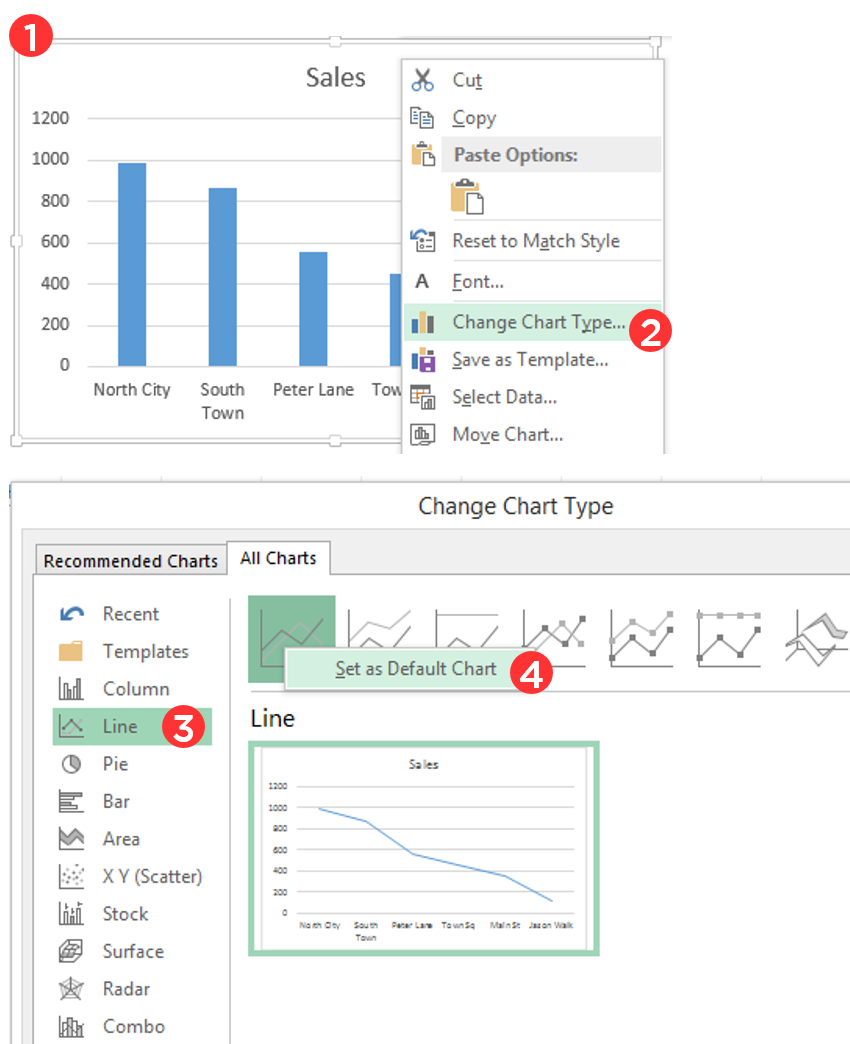
- Right click on any pre-made chart
- Go to Change Chart Type
- Click on Line (or any other chart type that you want to set it as default)
- In the sub category right click (on any chart) and set it as default
- This will save you a ton of time if you only want to create line charts over and over again 😉
3. Adding more Data to your Charts
What if you wanted to add cost along with sales in your chart
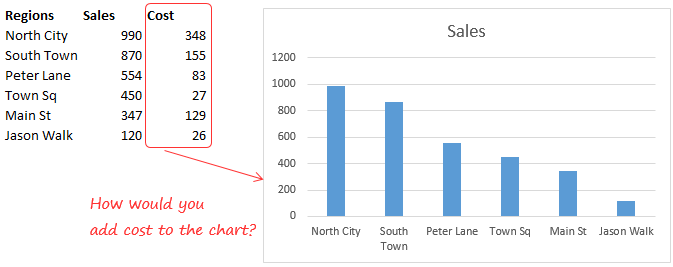
Here is a damn simple way. (I bet, you’ll fall in love with me)
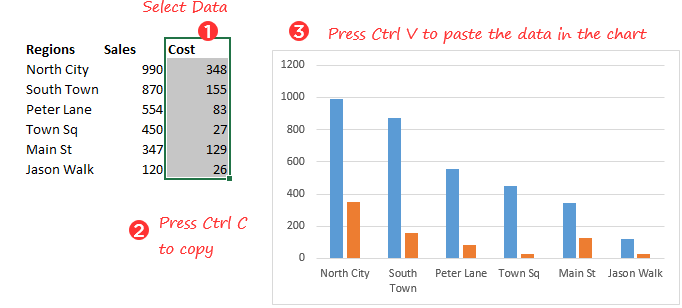
- Select the Data (along with Header)
- Press Ctrl + C to copy
- Select the Chart and Press Ctrl + V
- Make sure to turn on the legends, they don’t come by their own 😉
4. Format Any Chart Element by Pressing Ctrl + 1
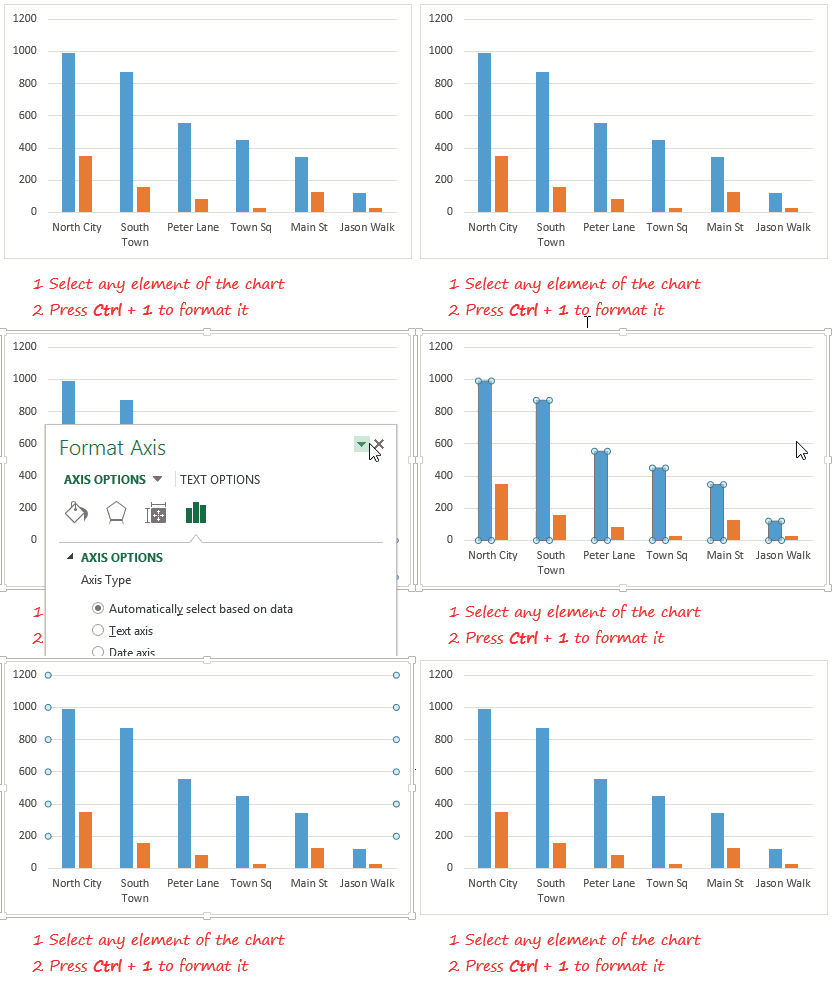
- Select any element of the chart (grid-lines, data series, legends etc)
- Press Ctrl + 1 to open up the formatting box
5. Format Any Chart Quickly
Assume that you have 2 Charts. First one is already formatted and the second one needs the same formatting as the first one. How would you format that?
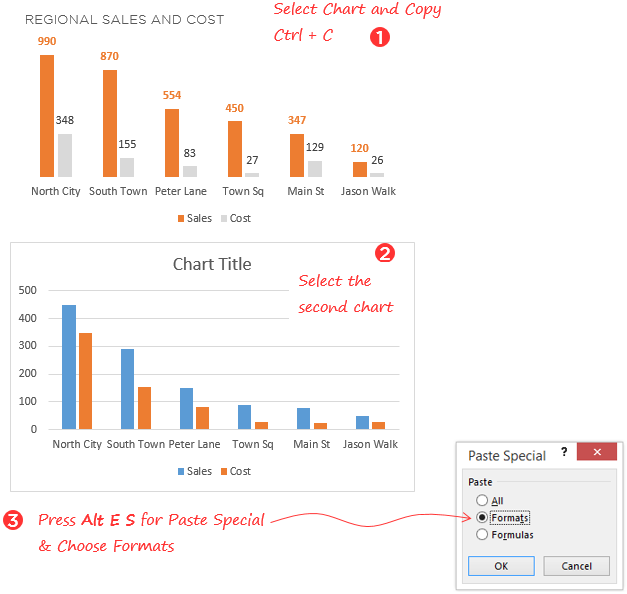
- Select and Copy the formatted Chart (press Ctrl + C)
- Select the second (un-formatted) chart and press ALT E S
- In the paste special box, choose Formats and click on OK
- Boom, all formatting copied in a jiffy!
What are your best charting hacks?
Let me know by leaving a comment!