1. Saving versions of your model
This is extremely important for the fact that any business projection goes through various iterations before the final assumptions and numbers are settled upon. Often you are asked to revert to old assumptions and calculations.
In case you have been over writing the excel file with new calculations each time, how do you think you would be able to access your earlier work?
Please don’t give me a counter reason for disk space! We have enough of it these days and that reason won’t work in case you are asked to revert back to your old calculation. You will have to do the re work. So.. save versions of your work
Here are 2 tips to do it effectively
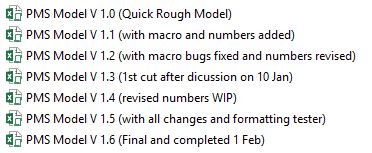
- Number the version as V 1.1, V 1.2 as you go along revising the work
- Also add a brief commentary about what changes have you made in this version
2. Logical Flow of the Model
A cramped up flow of linking different sheets can create 2 major problems
- Rectifying / Debugging an error in the calculation can become fretting
- The worksheet can significantly slow down or even get stuck when you need them the most
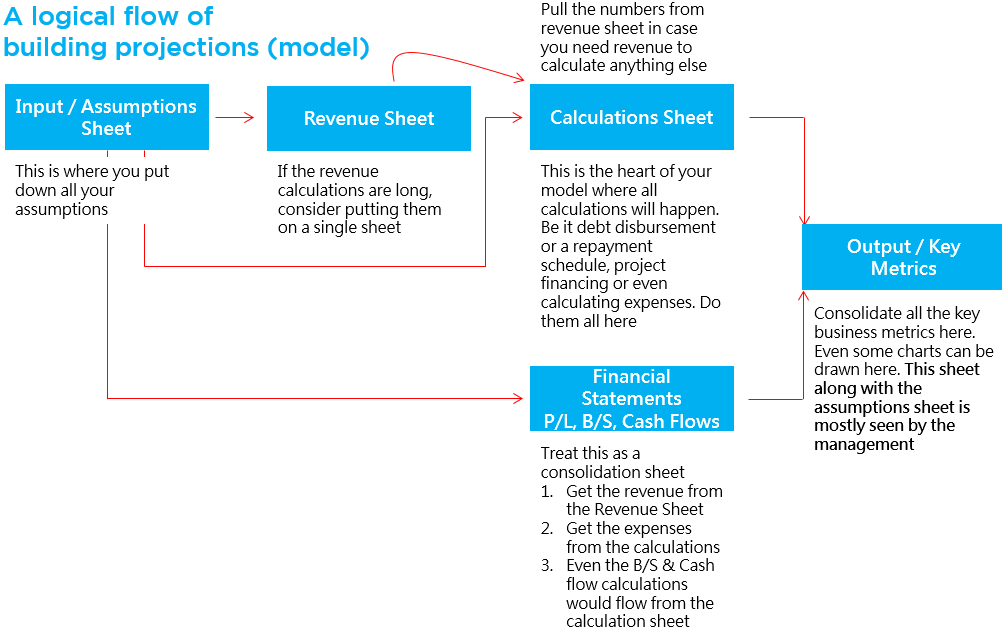
Here is how I recommend building a logical flow of projections
3. How to structure the Input / Assumptions Sheet
Here is quick snapshot of a sample Input Sheet
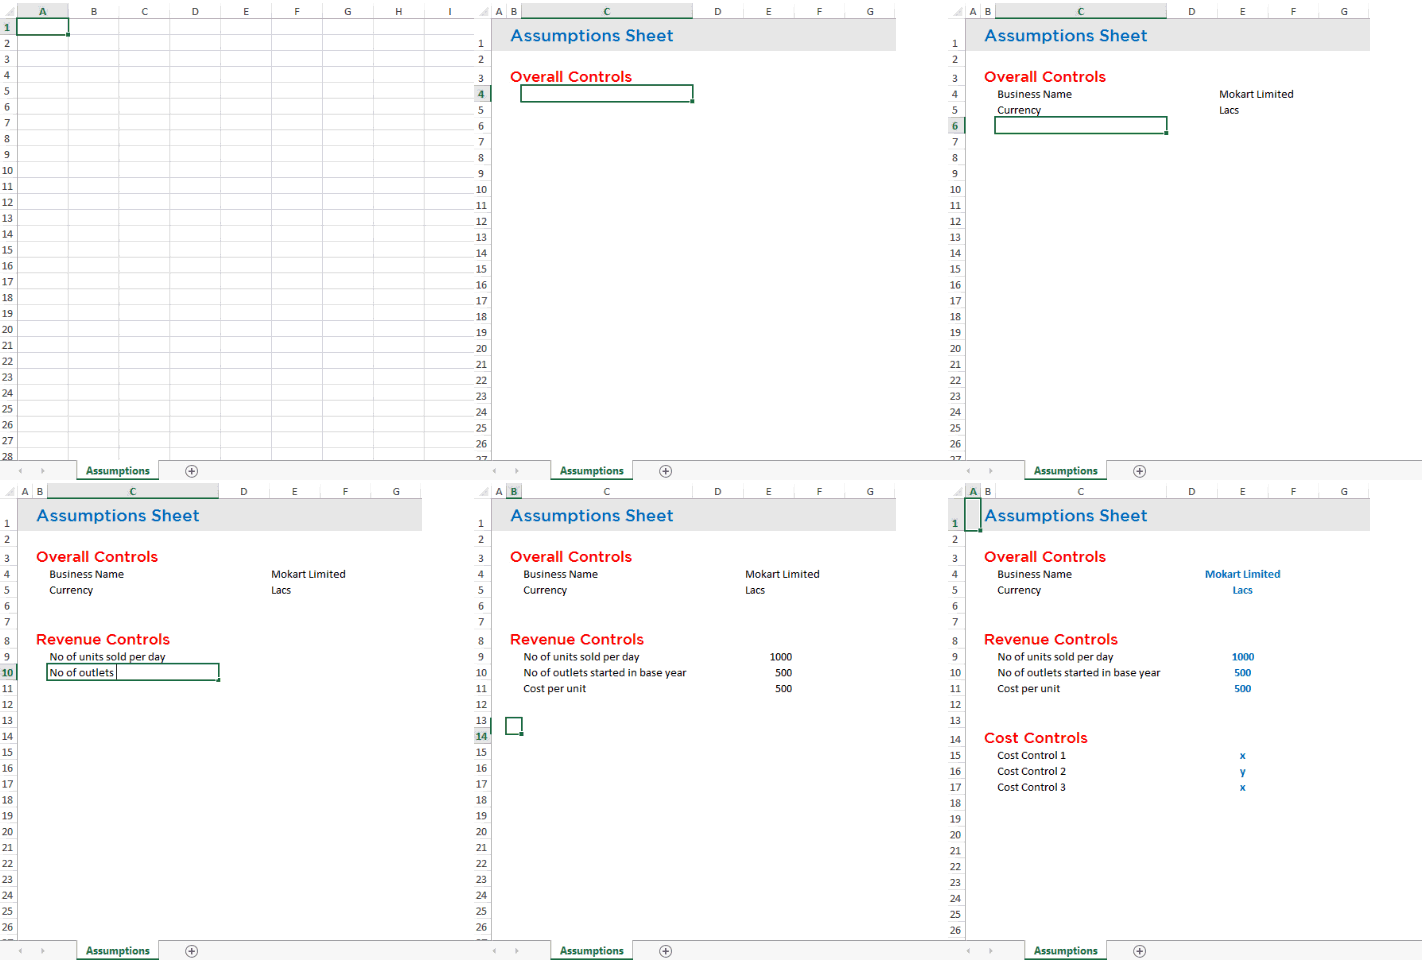
Note the key formatting tips
- Headline – As you can see, I have created a big bold headline for Assumption Sheet and this is going to be the same for the rest of the sheets as well (of course the title of the headline will change)
- Hiding the spare columns – After you are done defining the inputs, make sure you hide the rest of the columns which are not being used. This gives a neat and tidy look and also restricts your navigation to only the used area on the sheet. The shortcut to hide columns is CTRL + 0 (zero)
- No Grid-lines – Grid-lines look untidy, just hide them (from the view tab)
- Sub Headings – Note that the sub headings are of little larger font size and start from column B which is reduced in width (size 2) this is a smart indentation technique. When you start typing in the assumptions (from column C) they look indented to the Sub heading
- Inputs need to be in Blue (Very Important)– This is a universal rule followed in building projections and financial modeling across the world (personally I have seen it being used by most high end financial services companies you can think of). No wonder it is followed widely because it quickly helps anyone to differentiate inputs from formula driven outputs
- Description for Inputs – Often the inputs need a bit of description to help the user better understand the variable. You can fade off the description in grey and put them down in the spare column next to the variable in this case we have put them in Col F. Descriptions need to be legible enough to be printed and viewed but not so dark to acquire user’s attention
- Naming the Inputs (Very Important) – The inputs that you are going to use often while building your projections must be named with cell naming technique
Download the sample Input Sheet
4. How to Structure the Rest of the Sheets

Take a look at 6 columns labeled from 1 to 6 (in the picture above)
- Column A (width 2) – I have intentionally reduced the width of column A because that acts as a left margin from the start of the sheet. It helps getting uncut prints of your projections
- Column B (width 2) – This is where I will put all the sub headings and the reason for its shorter width is that it creates an indentation when you put down the calculation description in column C
- Column C (width 35 – 40) – The reason why this column is wide because the description of calculations can be lengthy and longer width prevents it from overlapping the contents of Col D or Col E
- Column D – This is our dummy column. I use for providing descriptions if needed
- Column E – Yet another dummy column, this provides incredible utility while writing formulas in column F
- You can put down all your base year values here
- Refer to this column if your formula (in column F) needs a previous empty column. Typically used for calculations like ‘Balance of anything till date’
- It brings consistency in formulas starting from projection years (Column F)
- Column F and onwards (Very Important) – Your projections should start from the same column in every sheet (in our case they start from Col F). It seems pretty simple but proves incredible utility while building projections
- Since in each sheet year 2016 belongs to column F, it will help you quickly identify if you have incorrectly linked the formulas in Col F to some other column (year)
- Also it provides amazing consistency and standardized look to your projections
5. Formatting Tips while writing formulas for projections
1. Do not hard code the values in your formula (Very Important) – Hard coding means punching the value in the formula and not linking it to a cell
![]() – Hard coded value
– Hard coded value
v/s
![]() – Linked cell
– Linked cell
It can be quite a task to change the value in 50 cells if your assumption changes, not to mention the risk of losing your job (may be I am exaggerating), just in case you forget to change the value in one cell. So link it and do not hard code!
2. Use cell naming often (Very Important)– This is one of many awesome speed boosting techniques to write structured formulas

By looking at the above formula,
- It become apparent that base year is compounded with a growth %.
- It becomes relatively a lot easier to write the formulas if you have named cells. You can fetch them as you start typing their name. Ideally all named cells should be kept in the assumptions sheet
If you don’t know how to name a cell check here
3. Grouping rows for space management – At times the calculation sheets can become really long and one of the smart ways to manage them is to group them together. That way you can scroll through the sheet faster. Here is how you do the grouping
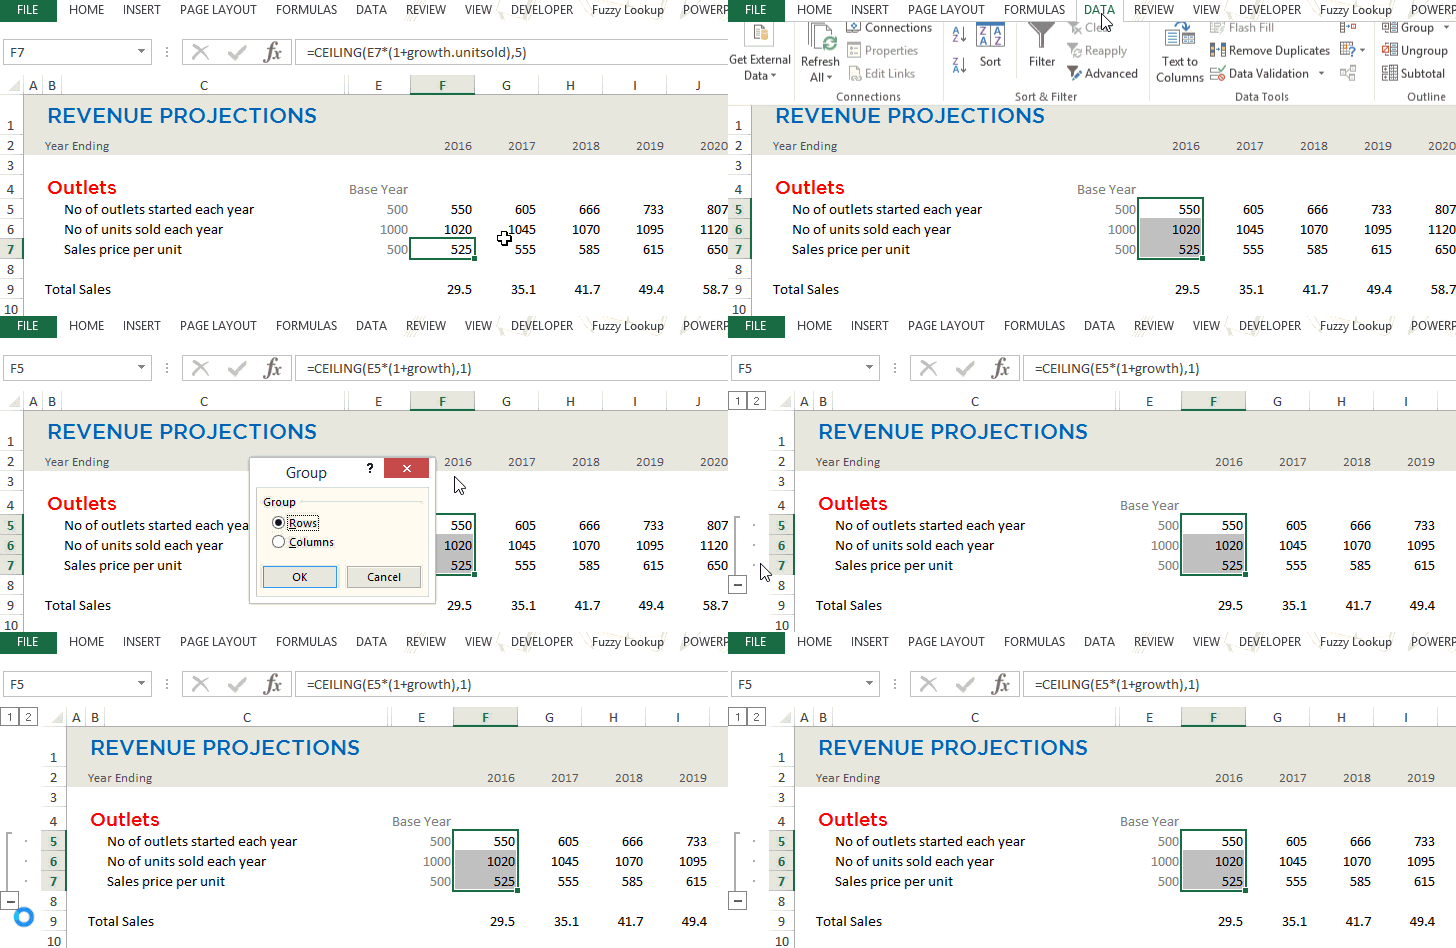
- Select the rows you want to group
- Go to Data and select Group
- Pick “Rows” from the Group Box. Instantly you’ll have an expand and collapse button on the left
- Just in case you want to Ungroup. Select the rows to ungroup and then go to the Ungroup option in the Data tab and follow the same process
4. Hiding extra columns to the right (Very Important) – This simple but powerful. Notice that I have hidden the columns to the right after column P (after year 2026). This will restrict my working area till column P

How will this help ?
- Because the area of your sheet is restricted. You can select all the cells till the end by using the shortcut Ctrl + Shift + --> (right arrow)
- You can replicate the formula in the rest of the cells by pressing Ctrl + R. Instead of copy pasting
It looks simple but when you have to write hundreds of rows of formulas this trick is actually a major time saver. Learn this trick in detail – Alternative to copy pasting (Ctrl R and Ctrl D)
Other Financial Modeling Resources & Techniques
- If you are beginner in Financial Modeling – Consider reading Financial Modeling Getting started
- Automate project finance models with Time Scales
- 10 Ever Green Excel Habits You Must Develop
What are your favorite formatting techniques?
Share your favorite formatting techniques while building projections / financial models
