I am super stoked to finally bring all my work together that I have been doing for the past 2 months and launch this course.
If you want to cut the chase and directly check out the course, here is the official link – BUSINESS INTELLIGENCE DASHBOARDS
If you are still hanging around let me give you some more details
This is a 100% self pace online training program and will teach you How to make Beautiful, Insightful and Interactive Dashboards using Excel.
Course Structure
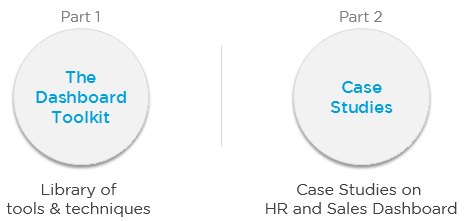
The course is split into 2 parts

- The Dashboard Toolkit – Library of tools and techniques that you can use in your own Dashboards
- Case Studies – I am going to use 2 business cases (HR & Sales) and will teach how to create dashboards from scratch
- Bonus Material – Dashboard Assignment + Formula Library + Practice Spreadsheets
You can download the COMPLETE COURSE OUTLINE – This is exactly what you are going to learn in the course
What is the level of the course?
The course is a step above the beginner / intermediate level. You need to have basic to intermediate level of Excel Skills. To be more specific you should be comfortable to work with
- Simple Formulas (like IF, Vlookup, Index Match, SumIf, CountIf etc..)
- Pivot Tables
- Charts (creating, editing and formatting)
- Some bit of conditional formatting
If you are not confident about Excel and want to learn Excel in depth along with Dashboards, then I strongly urge you to enroll in a combined course (BI Dashboards + Master Excel Step by Step). You can choose the combo option in the pricing plan
MASTER EXCEL STEP BY STEP is a comprehensive course on Excel and covers all important concepts in Excel (Basic to Advanced)
Check out the complete course details
The enrollments are closing on Friday, 14th July

