Someone asked this interesting question on the PowerBI forum. Interesting enough that it deserves a blog post and could be relevant problem for a lot of people around
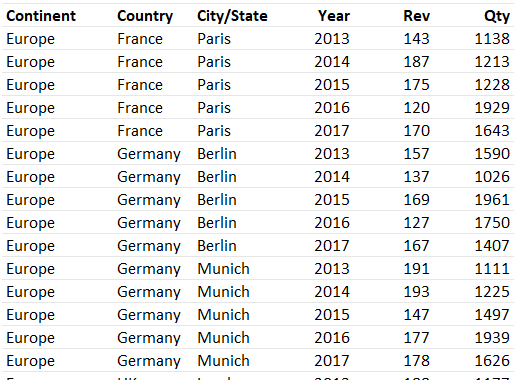
Consider this really messy data
Against each continent, country and city we have 2 metrics revenue and quantity for multiple years
How would you transpose this in a tabular format ?
This is how the expected result should look like
Please don’t say cut, copy and paste. You really need a heart to transform the data that way! I’ll post my solution soon!
DOWNLOAD THE EXCEL PROBLEM HERE
Watch the Solution Video ..
Other Power Query Problems


