 Pivot Tables have been an all time favorite for most analysts and managers, especially for their simplicity and powerhouse utility. Today let’s inject a steroid named DATA MODEL to our standard pivot tables. But these steroids are available only in Excel 2013
What a DATA MODEL can do for you?
A data model can link multiple data sets (converted into tables) and make a single pivot table. It additionally has a few new formulas for advanced analysis.. let’s not just talk about it but experience it!! Ready for the steroid ?
A Case
Consider these 2 data sets. Sales transaction data (get Raw Data here)
and customer data. Note that the customer code used in the sales transaction data are mentioned in this table with the customer name and their association date 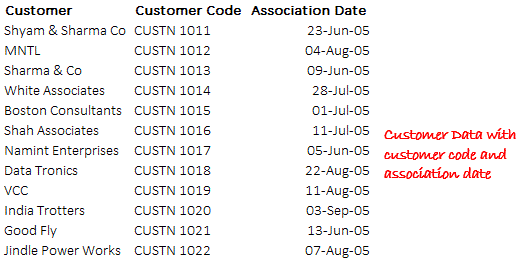
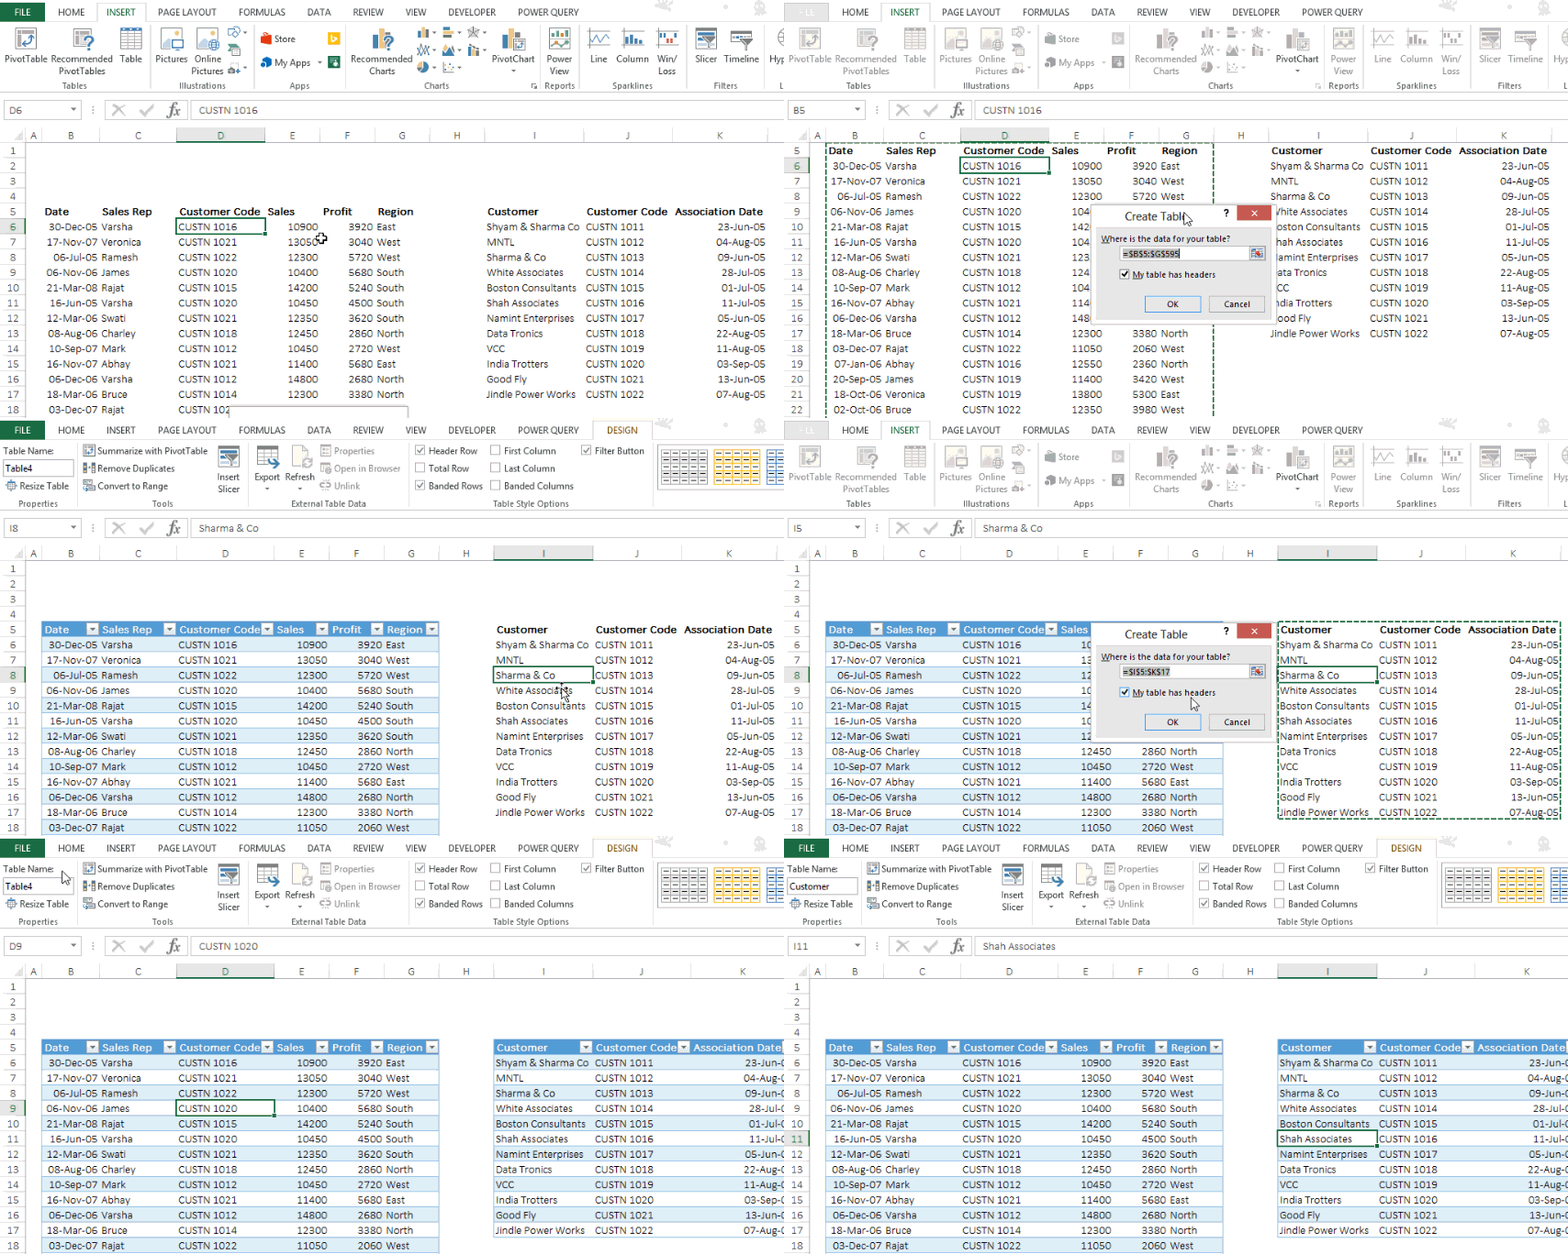
Convert the data into tables
- Place the active cell anywhere inside the data and use the shortcut CTRL T to convert both the data sets into a Table
- Name the Sales Transaction Data as ‘Sales’ and the Customer Table as ‘Customer’
- To name a Table --> go to Design Tab (appears when the active cell is anywhere inside the table) -->Table Name on the extreme left --> Enter name there
Time for some Concepts
To use DATA MODEL effectively you will need a good hold on the following concepts
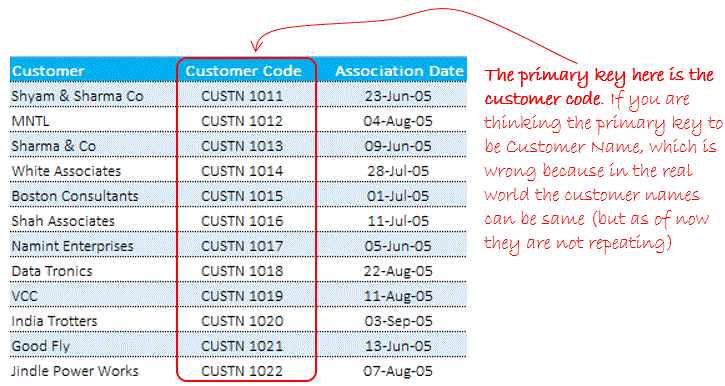
1. Primary Key
Sound like you have heard it ?? It is the genesis of forming data relationships. Any item (column header) which is unique (non repetitive) in a set of data is the Primary Key. Could you guess what is the primary key in our sales data ?  Ok, what is the Primary Key in Customer Table?
2. Foreign Key
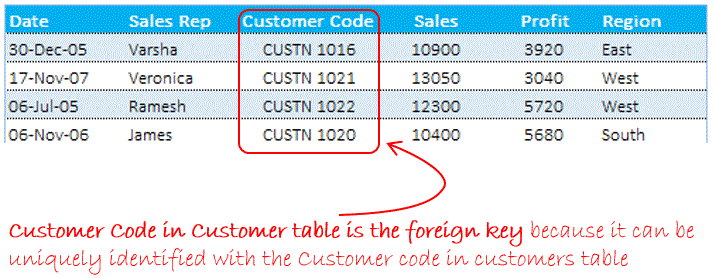
It would be repeated records in a table which can be uniquely identified by unique records in another table.. Eh?? Ok Ok sorry for the weird definition take a look at the example.. Customer Code in Sales Table is a Foreign Key, WHY ? because the records are repetitive and if I want to summarize all transaction of a particular customer code, I can refer to Customer table with unique customer code that matches with the customer codes (multiple entries) in the Sales table!! I hope you got it this time.. NO?? Read again, slowly, you'll get it
Coming back to Pivot Tables
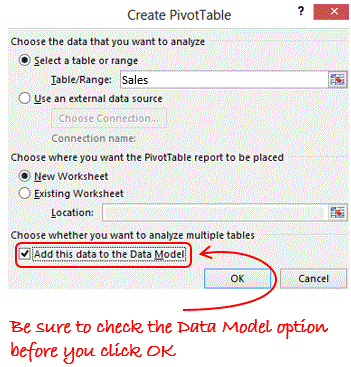
Make a pivot table from the Sales table and be sure to check the data model in the Pivot Table dialogue box
Take a look at the pivot table field list, Sales table has been added. Note a few visual and conceptual differences than the usual Pivot Tables
- A little table symbol in front of Sales – displaying column headers in it
- A separate tab for Active tables and All tables

Take the Customers from ALL Tab to the Active Tab

Time to get into a relationship 😛
Yes you read me right.. but for the time being the relationship is primary or foreign and is between the Customer and Sales tables 😆
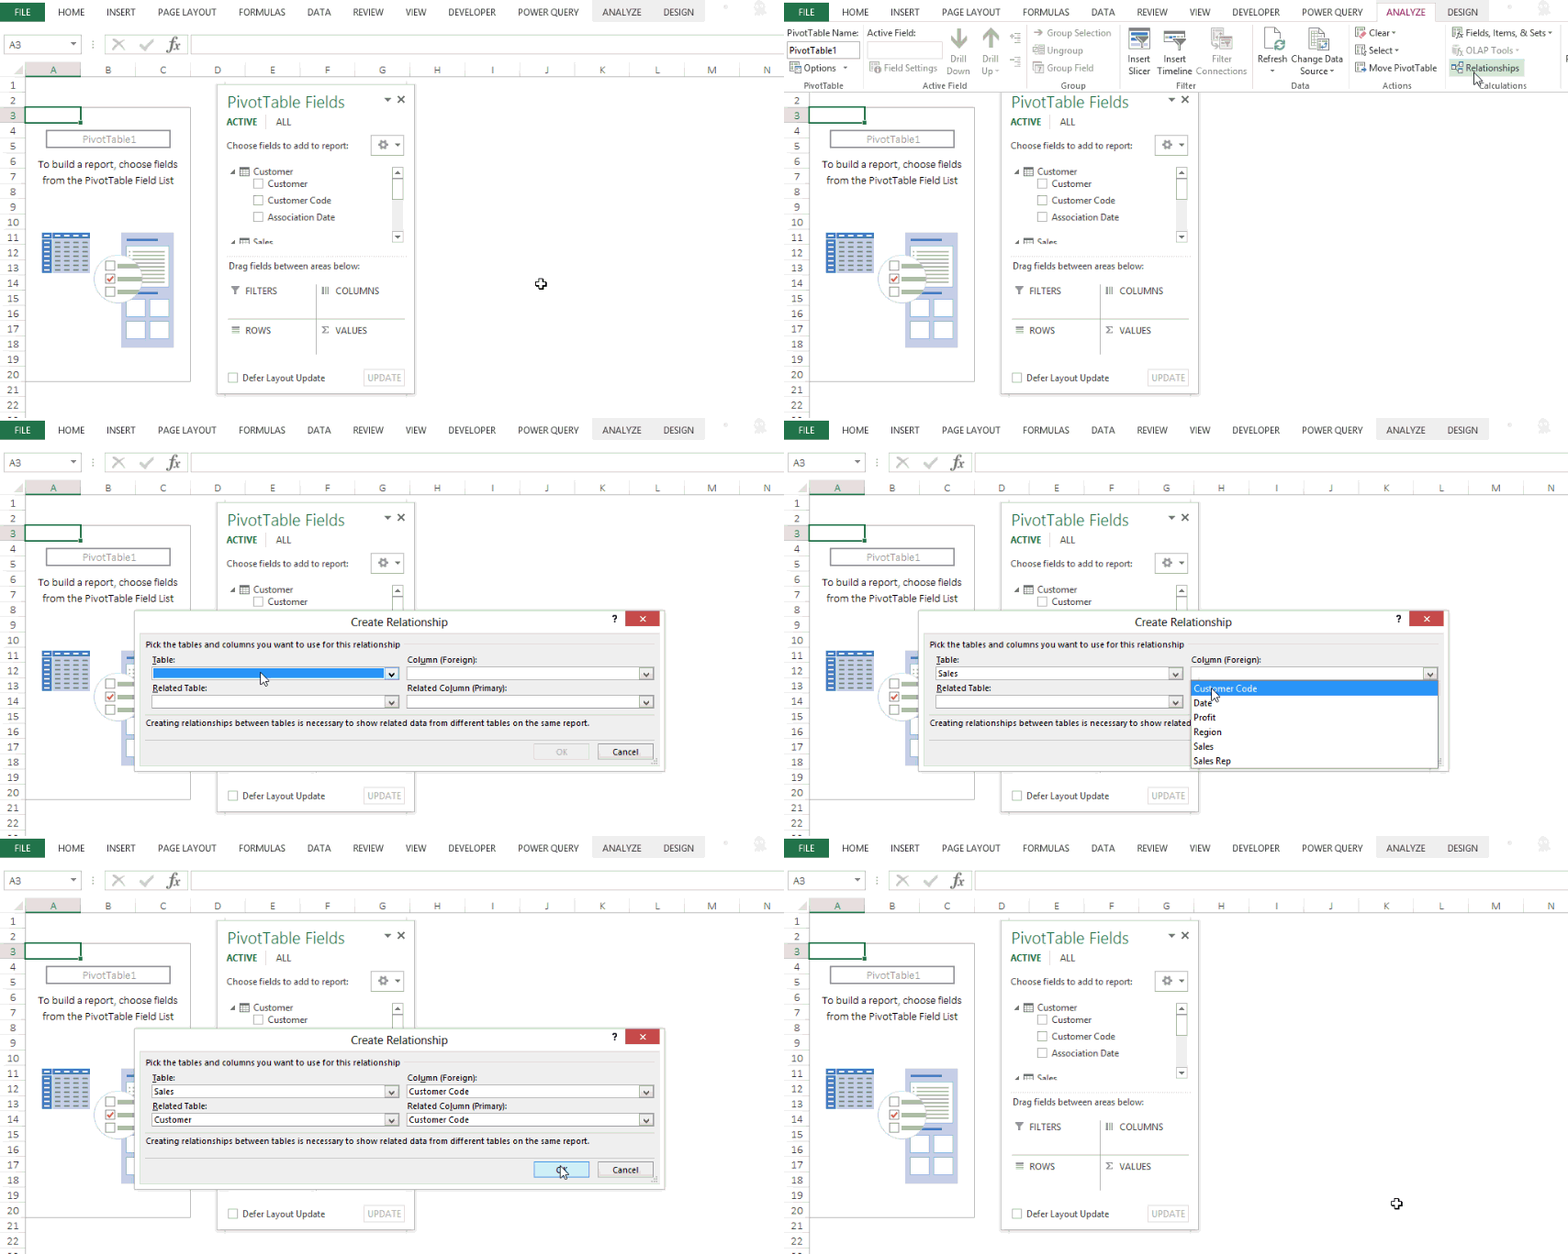
- In the Analyse Tab --> Click ‘Relationships’
- Click New --> to establish a new relationship.
- In the Create Relationship box --> Table Field --> choose Sales Table --> and Foreign Key here is Customer Code
- In the Related Table Field choose Customers Table --> Primary Key here is Customer Code
Done!!
Time for some magic !
Lets make a pivot table report for Sales – Customer wise. Notice a couple of interesting things going around here..!!
- You have two tables Sales and Customers and their columns to choose from
- I have taken Customer (name) from the Customers table and Sales values from the Sales table and made a pivot out of it
- The VLOOKUP has become redundant here .. Smart isn’t it? 😎
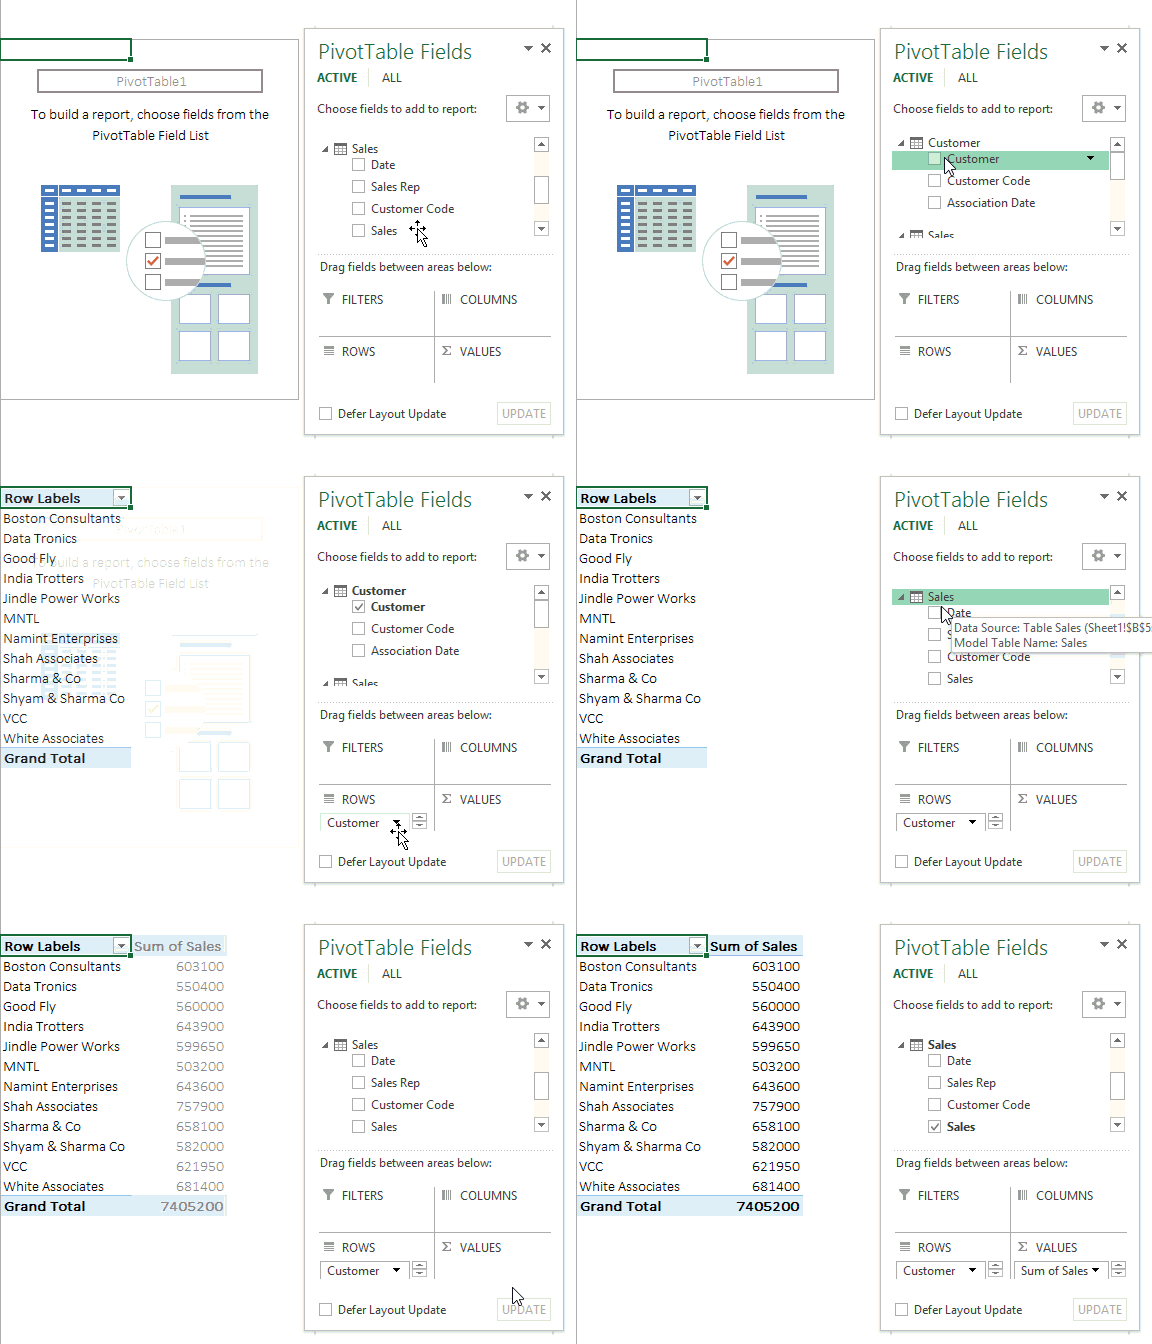
This way you can link multiple tables in a single pivot table
Distinct Count in DATA MODEL
If I ask you the non repetitive count of customer wise sales transactions..?? Oooah!! that would require some serious formula geniuses. DATA MODEL let’s you do that in just seconds
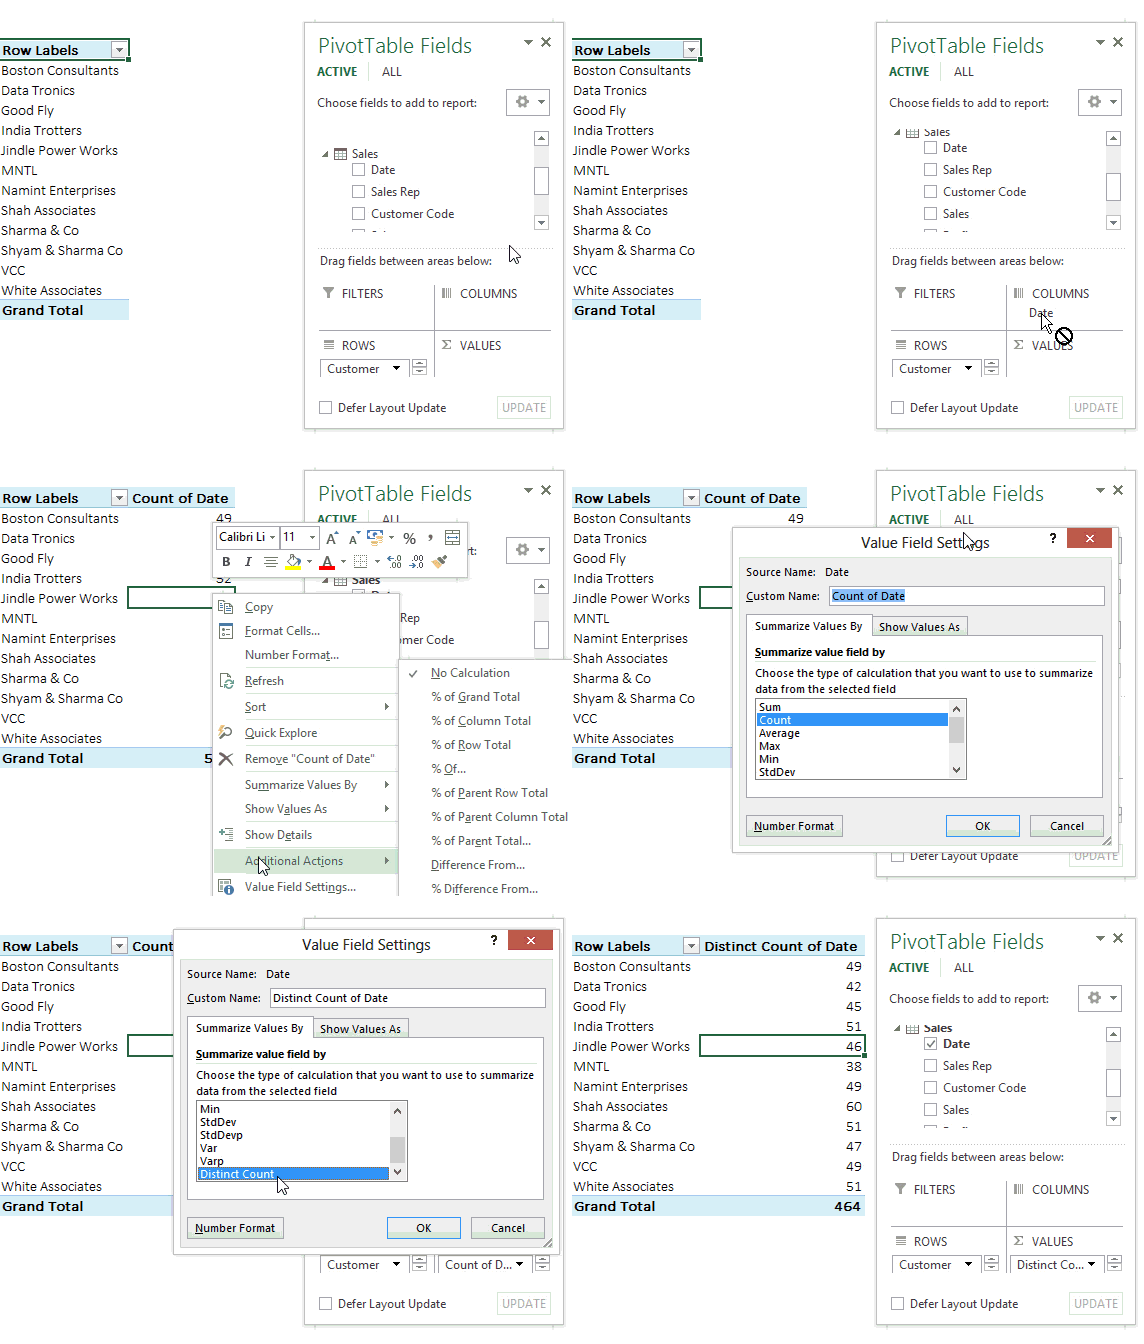
- Simply drag the Date in Values (against Customer in Rows)
- You’ll get the total count of number of transactions customer wise (but they are repetitive and we want a non repetitive count)
- Right click on the count of Dates --> Value field settings --> Distinct Count
- And boom it’s done!! It is new formula available in only in DATA MODEL in Excel 2013, apart from PowerPivot
Download the finished file from down below and try it yourself
Additional things about DATA MODEL (Pros and Cons)
- Identical data type in both columns: Columns that you are connecting in both tables should have same data type (for example we connected Customer Code in Sales Table and Customer Code and Customers Table)
- One to one or One to many relationships only: It means one of the tables must have no duplicate values in the column where relationship is established
- Grouping feature for dates – does not work in DATA MODELS. Don’t get disheartened, there is way to group dates in quarters or months or years 😎
- It becomes too slow or even dead while handling too much data
How did you find this feature?
I found this incredibly useful to perform powerful analysis and getting rid of VLOOKUP for good. What are your views about this feature.. share using comments!! Take Care
