Suppose you have a transaction table with products and sales, its easy to get sales by products, but what about the products that DID NOT SELL? It is not very straightforward to find unsold products. In this post, you will learn how to find such missing / unsold products using some DAX.
Find Missing Values (Products) in Power BI
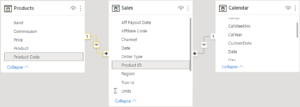
Consider this Data Model
- Sales and Products Tables are related: Product ID (Sales) <> Product Code (Products)
- Sales and Calendar Tables are related: Date (Sales) <> Date (Calendar)
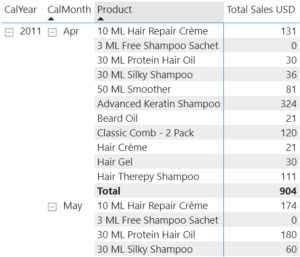
Using Products Table to Report Sales
Here, I do get total sales of products that were sold in each month, however, I don’t get to see the the UNSOLD products in each month
To solve this we can use the existing Products dimension table
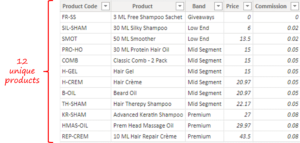
This table contains the list of all the products available to sell. As a simple reconciliation check we can see this table against the sales of products each month and find which products are not present. However, this a laborious task if done manually. So we use DAX!
Find Missing Products using DAX
I am going to talk about 2 approaches here: CONCATENATEX Approach & COUNTROWS Approach. The crux of both the approaches is that
We compare the list of sold products with the products dimension table (which contains all products) to see which products didn’t sell.
#1 CONCATENATEX Measure:
Missing Products =
VAR SoldProducts = VALUES(Sales[Product ID])
VAR ProductsAvailable = ALL(Products[Product Code])
RETURN
    IF(
        [Total Sales USD],
        CONCATENATEX(
            EXCEPT(ProductsAvailable, SoldProducts),
            Products[Product Code],
            UNICHAR(10)
            )
        )

- We created 2 variables that store ProductsAvailable list and SoldProducts list.
- EXCEPT function returns a list that has all values from list 1 that are not there in list 2.
- UNICHAR(10) – new line – is used as a delimiter.
Here’s the output. Sweet!
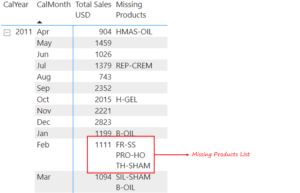
The drawback with this approach is that if we have a long list of unsold SKUs, say 100, the concatenated list will become quite lengthy and difficult to comprehend. To solve this we use the COUNTROWS Approach and display a cross ❌ against each unsold product.
#2 COUNTROWS Measure:
The best way to visualize a long list of the missing products would be to have a Missing Products column that marks ❌ in case the product is unsold.
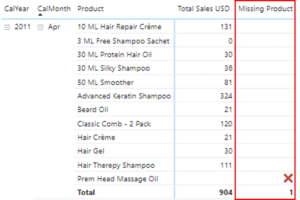
Missing Product =
VAR AllProd = VALUES(Products[Product Code])
VAR SoldProd = VALUES(Sales[Product ID])
RETURN
    IF(
        SELECTEDVALUE('Calendar'[SalesPresent]),
        COUNTROWS(EXCEPT(AllProd, SoldProd))
    )

- We created 2 variables AllProd and SoldProd.
- These variables store lists of unique Product Codes/ID from Product and Sales Tables respectively considering the filter context.
- The SELECTEDVALUE is a Boolean column in the Calendar Table which flags TRUE for dates which fall between the entire sales period.
- Just like before instead of concatenating multiple values, I instead use COUNTROWS(EXCEPT(AlProd, SoldProd)) to count the missing products.
SalesPresent = // this is column created in the calendar table
('Calendar'[Date] <= MAX(Sales[Date])) &&
'Calendar'[Date] >= (EOMONTH(MIN(Sales[Date]),-1) + 1)
One Last Thing – The above measure returns the count of the products, this can be changed to ❌ by simple conditional formatting to get the final result.
More on DAX:
- Optimizing IF using MAX and MIN Functions
- Switch Between Calendar and Fiscal Year – Power BI
- 3 Ways to Find Duplicate Values in Dimension Tables
- Related and RelatedTable in DAX
- Debugging DAX using CONCATENATEX