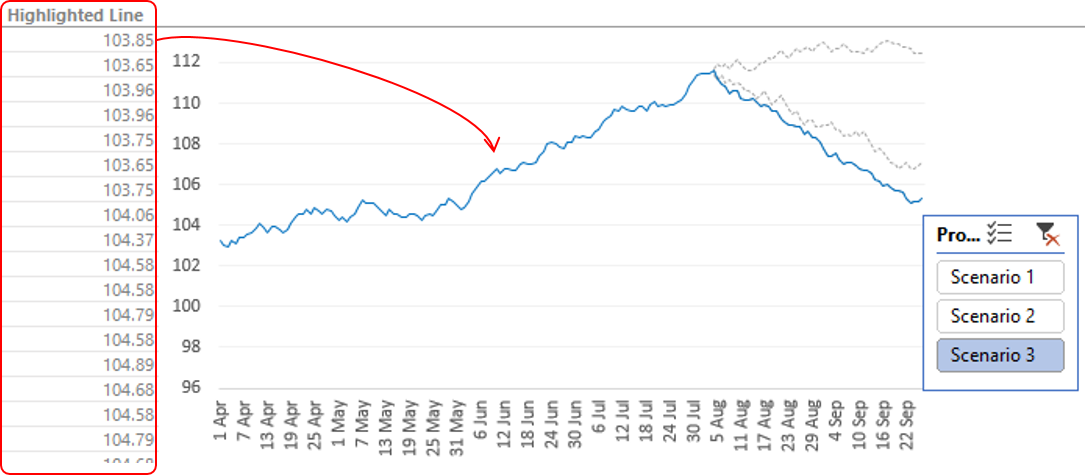
Plotting multiple projections in a Line Chart – 7 Published September 5, 2017 at 1085 × 475 in Plotting multiple projections in a Line Chart ← Previous Next →