
Quick Recap of what happened yesterday!
Yesterday was Sunday (23 Apr) and I binged like a mad man. Blueberry Jam Cake, Salted Lentils, Stuffed Pranthas, Beer, Chicken, Ice-Cream, oh yes.. and the lunch was separate 😀
But I burnt this all.. How ?? I walked for an hour in a scorching summer evening holding my notorious Son (often found dancing on my head)
In less than 20% of my day’s time, I burnt all the junk that I ate throughout the day. Classic example of 80-20 rule
You’ll find a ton of real life (business) examples which abide by the 80-20 Rule. Let’s take an example of how would you perform 80-20 (a.k.a Pareto) analysis in Excel
Consider this Dataset..
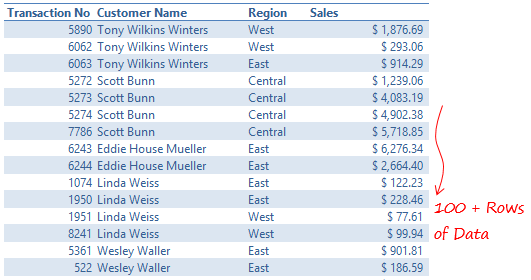
A simple sales data set with
- Transaction No
- Customer Name
- Region of Sale
- Sales Amount
80-20 Analysis : What if as a manager I would like to see the top (20%) customers that contribute (80%) of the Sales. Note that in most cases you wouldn’t find the numbers to be exactly 20% or 80% but this has been theoretically correct.
In my option these days the numbers are getting more and more skewed, for eg 2% of customer that contributed to 95% of sales
Anyways let’s see how can this be solved in Excel and just to make things more interesting, I would like to also filter the Customers by Regions as well (i.e. top 20% customers in East, West, North or South and Overall)
Create a Pivot Table
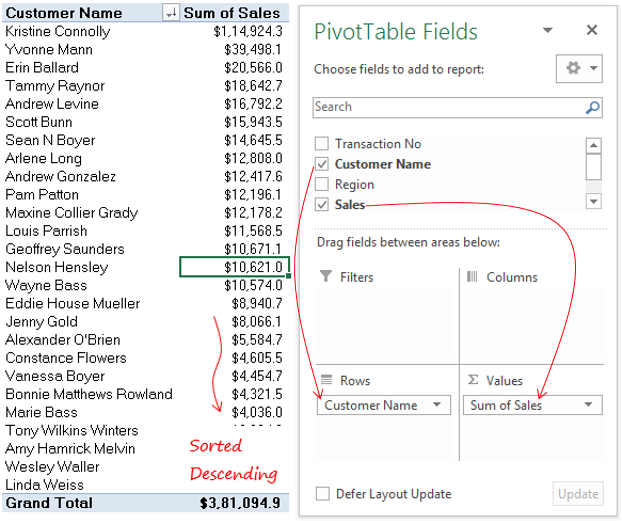
3 Quick Steps after you create a Pivot Table
- Drop the Customers in Rows
- Drop the Sales in Values
- And sort the Sales in the Pivot Table in the descending order
Find Running Totals
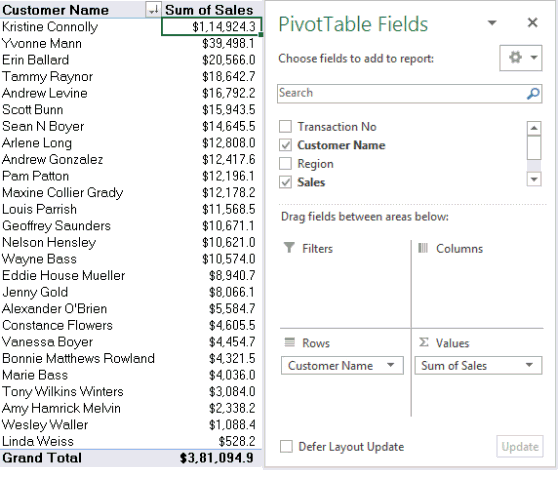
- Add the Sales in the values once again. Sum of Sales will appear again in the Pivot
- Right Click on Sum of Sales (2) in the Pivot Table and go to Value Field Settings
- In show values as pick Running totals in % and apply that calculation on the Customer field
- And Boom Done!
What this is showing you is that – how Sales are totaling up to a 100% and now you can easily find out which customers contributed 80% of the total sales
Filter by Region using a Slicer
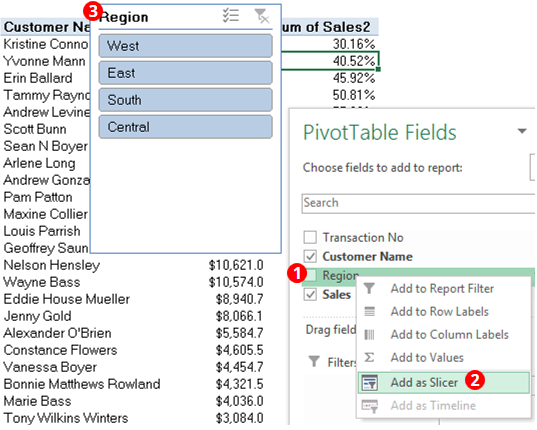
Now it’ll be pretty cool if I can do the Pareto analysis and split the sales contribution by region too!
- Right Click on Region in the Pivot Field List
- Choose Add as Slicer
- A Slicer (filter) gets added in the sheet and clicking on any of the region will filter the report by the specific region selected
Related Topics
- Learn everything about Slicers
- Learn everything about Slicer formatting (how to make them look sexy)
Create a Chart Instead!
Now that we have the report ready, it would be nice to behave like a civilized analyst and create a dynamic chart 😀
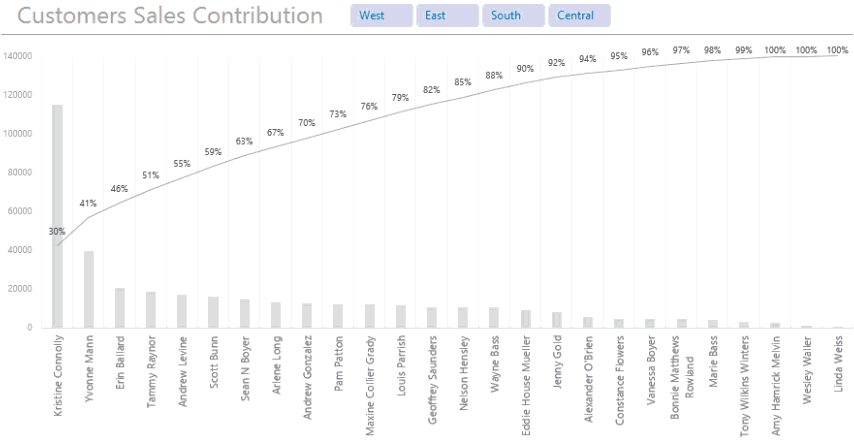
Don’t get too bedazzled by this. All that I have done is
- Created Pivot Chart (for Sales and Running Total %)
- Formatted the Slicer a bit and placed it on the top
- Done!
For Video Lovers..