I am going to start writing about slicers assuming that you don’t know about them at all and then graduate you to more complex nitty gritties of slicers.
Slicers happen to be one of the most interactive and simple to use features in excel. Let’s begin with the basic question..
What are Slicers?
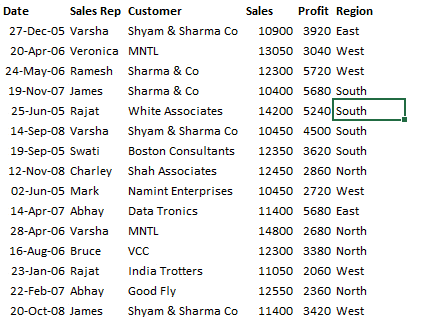
Think of slicers as interactive buttons to filter your pivot tables. Let’s take a look at this pivot table
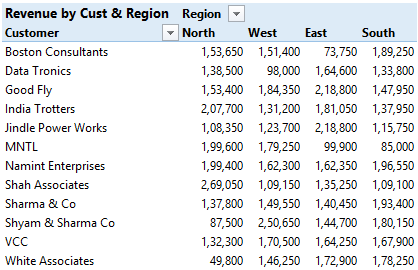
We have sales displayed by Regions and Customers
But what if you wanted to see Sales for only West? Obviously you’ll apply a filter or put regions in Report Filter. But hey!.. here is what you can do it with slicers
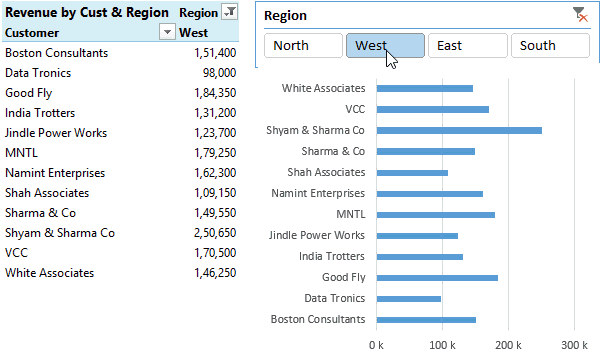
- Did you notice the interactivity ? – you can change the regions with buttons
- The back end pivot table (on which the chart has been made) is also changing
How to insert a Slicer?
Assuming that I have caught your attention, let me now tell you how can you insert a slicer in your pivot table
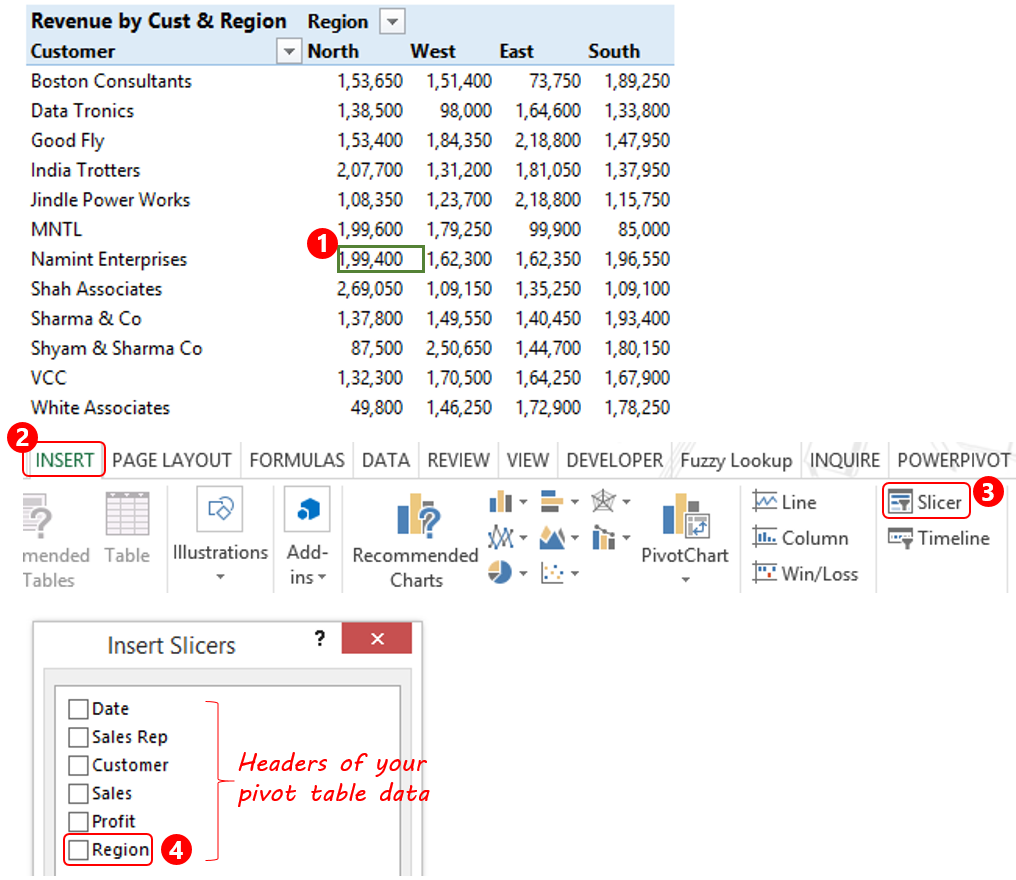
- Click on any cell in the pivot table
- Go to the Insert menu and
- Click on Slicer
- In the Insert Slicer Box, choose field/s on which you want the slicer. In our case it will be ‘Region’
- Done! Instantly you’ll get an interactive button displaying all four regions. Clicking any region will filter the pivot table
Slicers auto update when the data changes..
- Now assume for some reason that if the data changes – 2 records (regions) edited as South West and North East
- Now go to the pivot table and press CTRL+ALT+F5 (shortcut to refresh the pivot) and you’ll see that the new regions are now updated in the region slicer
Slicers can also be added to Tables..
As of now we are creating a pivot table from our data and then applying slicers to it! Alternatively you can also apply slicers directly to your data (after converting it into a table). This is specifically an Excel 2013 (and above) feature and it is pretty awesome. Take a look..
Step 1) Assume that we have this data
Step 2) Convert the data into a Table
- Select any cell from your data and use the shortcut CTRL+T to convert it into a table. Note that the data must have headers (column names)
- Now that we have the table structure, in the Insert Tab click on Slicers
- As soon as you click on slicer buttons the table will get filtered! Pretty cool eh?? 😀
Connecting Slicers to Multiple Pivot Tables!
A single slicer can be connected to multiple pivot tables. That means a click on one slicer will change multiple pivot tables. Take a look at how that happens
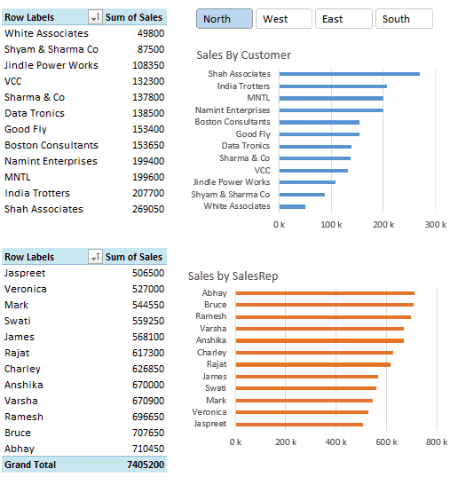
- Note in the above image I have 2 pivots and their respective charts
- But at the first time, the slicer (on regions) is changing just one pivot table (& Chart)
- To connect the slicer to both the pivot tables. Right Click and go to report connections
- Check on the pivot tables that you want to link to and click on OK. Now the slicer will refresh both pivots and charts
A few important things to note
- You can connect the slicer to multiple pivot tables which are made from the same source data
- A Slicer won’t be connected to a pivot table which comes from a different source data
- By default the slicer is only connected to one pivot table (on which you create the slicer)
Where can you use slicers..
- Slicers are pretty powerful to create interactivity in Excel and provide stunning visualization as well.
- If you work with Report Filters, you can replace them all with Slicers.
- Plus slicers can also connect/disconnect to multiple pivot tables unlike Report Filters
DOWNLOAD THE WORKBOOK WITH ALL EXAMPLES USED FROM DOWN BELOW
Slicer Compatibility Issues!
- Slicers were a new feature added in Excel 2010 on-wards.
- If you create a slicer in excel 2010 and open that in workbook in excel 2007, slicers won’t be visible 🙁
- In Excel 2013 (and on-wards) 2 additional features were added
- Timelines – we’ll talk about this in the coming posts
- Slicers in Tables – As discussed above
How often do you use slicers?
Are you an avid slicer or is it the first time you are learning about slicers?
- If you are newbie slicer – How would you use them in your work or post questions if you have any ?
- If are avid slicer – Share your tips and tricks in the comments ?
I am personally a very avid user of slicers especially in my dashboards and dynamic reports
Coming Up Next …
Making your slicers look classy is one hell of a job, so I am going to discuss with you some awesome tips for formatting slicers + some bonus tips for handing multiple slicers in a single dashboard
Other Interesting Tutorials
- Pivot Table Tricks and Hacks
- Use Drop Downs to make Interactive Charts
- Evergreen Productivity Hacks for a Daily Excel User
- Advanced use of slicer – Visualization Contest Entry
- Advanced use of timeline – 30 Day Challenge Dashboard