Running Totals are pretty common calculations to be done in Excel. You’d do something like =SUM(A$1:A1) in excel and drag the formula down and bingo! But running totals aren’t as straight forward in Power BI as they are in Excel.
In this post I am going to show you how can you do Excel like Running Total and Conditional Running Total using Power Query
Check out this Simple Data
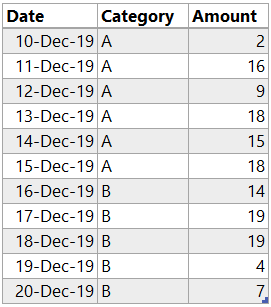
What I want is to have a Running Total (for Amount) Column in this table. Let’s load this data in Power Query and take it from there.
Adding an Index column
In Power Query there is no row reference like excel, unless you add an Index Column. So let’s add an Index Column. Add Columns Tab >> Index (starting from 1) and our Data looks like this..
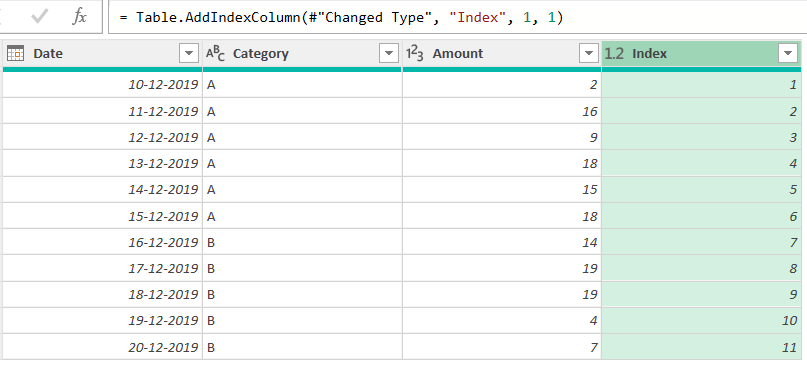
Now let’s add a Custom Column for calculating Running Total. Add Columns Tab >> Custom Column and write this tiny M Code
=List.Sum(
    List.FirstN(
        #'Added Index'[Amount],
        [Index]
    )
)
Note a couple of things
- [Amount] is the column for which I want the running total but I have also written the table name before it (i.e. the name of the previous step) since I’ll be inputting this column as a list.
- [Index] is just inputted as a scalar value for each row of the column.
Nothing too complicated and this gives you the running total! Result looks like this..
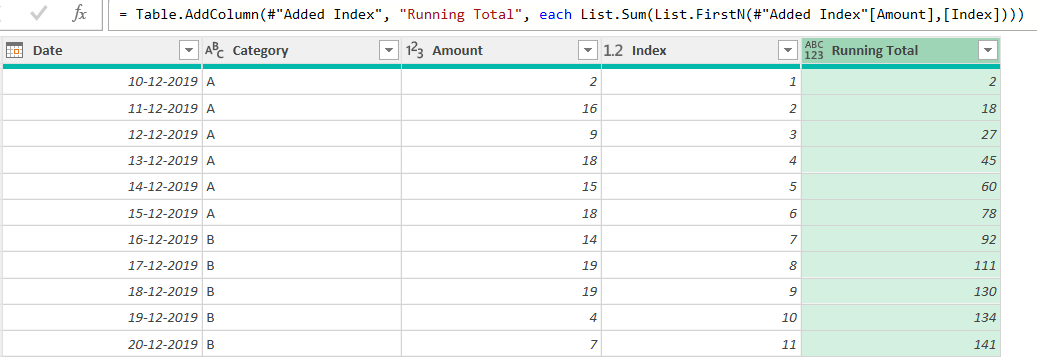
This is pretty standard stuff another tweak in the problem could be getting a conditional running total. When the category changes (to B) the running total should also refresh!
Conditional Running Total in Power Query
Expected result of running total should be like this, running total refreshes when the Category changes to B
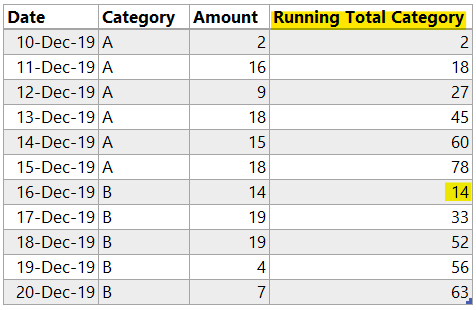
Let’s start with loading data in Power Query and just like last time I have already added an Index column (starting 1) in my table. My query as of now looks like this..

Just to make sure that formula is fast and snappy, It’s a good idea to buffer the table. So as a next step I am going to do that
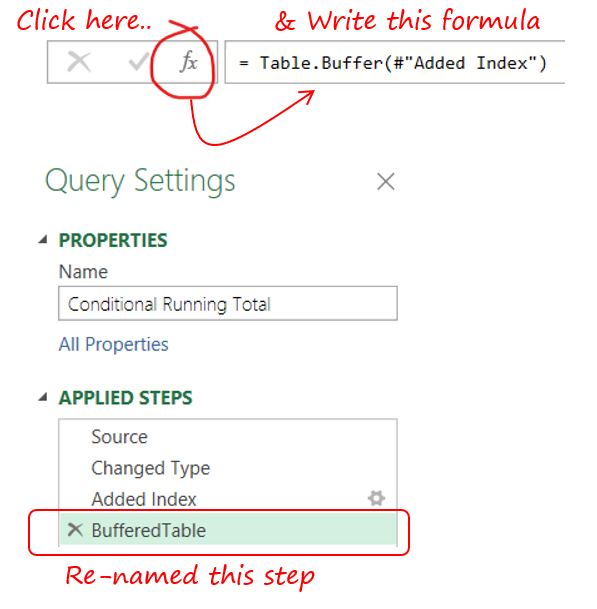
- Click on the fx button
- And write the code in the formula bar
- Also I renamed the step created as BufferedTable
Note that
- The result of this step will result in the same table, but buffered (in simple words optimized for speed).
- Inside Table.Buffer function I have written the name of the previous step.
Now comes a nasty formula (for conditional running total). Ready for this ?
= Table.AddColumn(
    BufferedTable,
    'Running Total',
    (OutTable) =>
        List.Sum(
            Table.SelectRows(
                BufferedTable,
                (InTable) => InTable[Index] <= OutTable[Index]
                and
                InTable[Category] = OutTable[Category])[Amount]
        )
    )
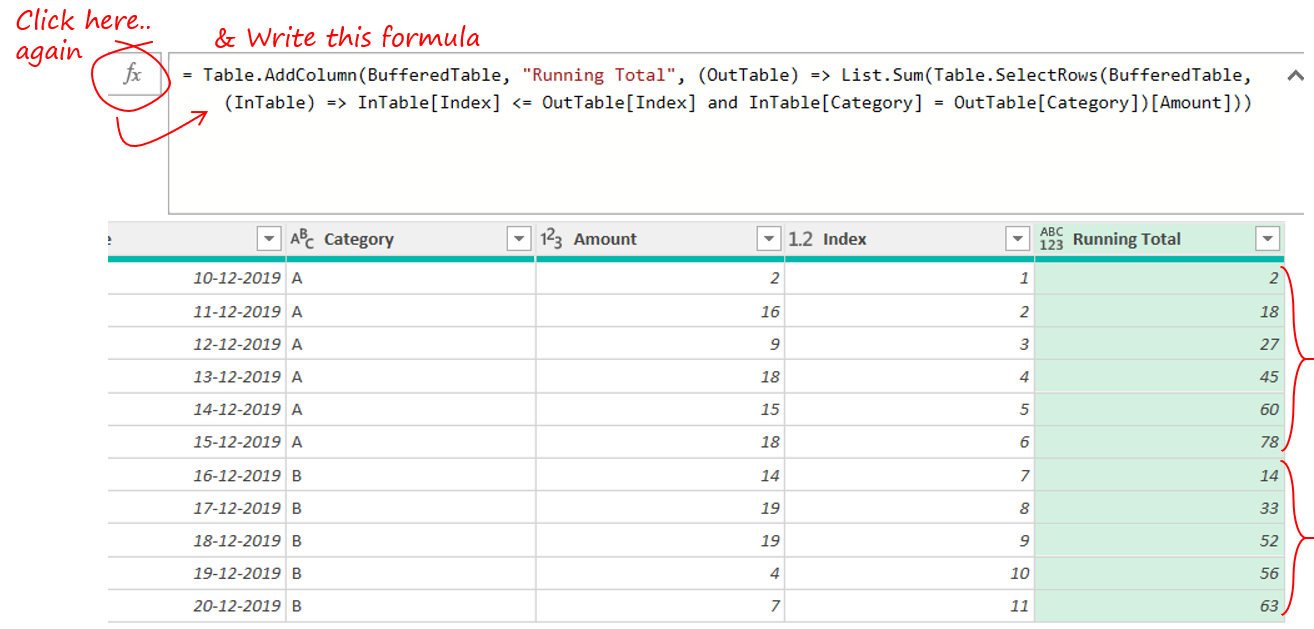
- Again click on fx button
- And stick the above code in the formula bar. The items in blue are variable and you can change them as per your query
- Let me explain the code in simple words
- I am generating a table for each row of the table.
- The table for each row is filtered by two conditions Index number and Category
- From the filtered table, pick up the Amount Column and sum it up.
- Also you won’t always need the Index column column. You’ll need if you don’t have a date (or any numeric) column to create an expandable range/ table.
A lot more detailed explanation is given by Mike Girvin in his video. I have just learnt and copied his trick. thanks Mike
More Calculations Tricks in Power Query
- Create Dynamic Column Names
- Calculate Custom Fiscal Year and Quarter in Power Query
- Filter Data with Multiple Conditions in Power Query– Similar to Advanced Filter in Excel
- SUMIF in Power Query
- Calculate Age in Years and Months in Power Query
