If you tried to find or write SUMIF in Power Query, you won’t be able to because there isn’t one! But that doesn’t mean that we can’t do a SUMIF in PowerQuery. There is something known as a “Group By” feature in Power Query which offers the same (and a lot more) functionality as the SUMIF function in Excel.
Let’s Take an Example
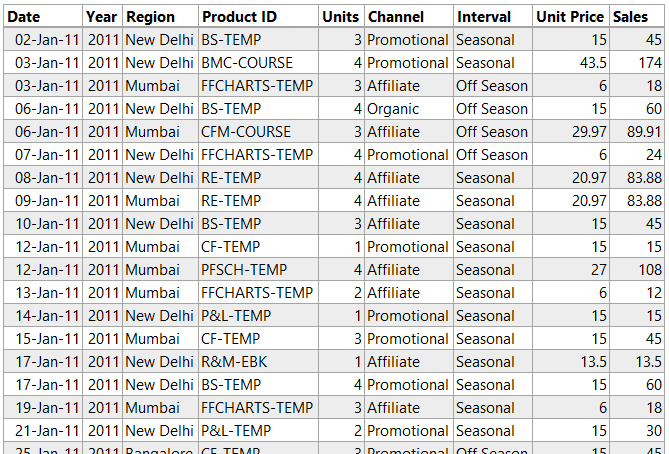
Here is some random Sales Data
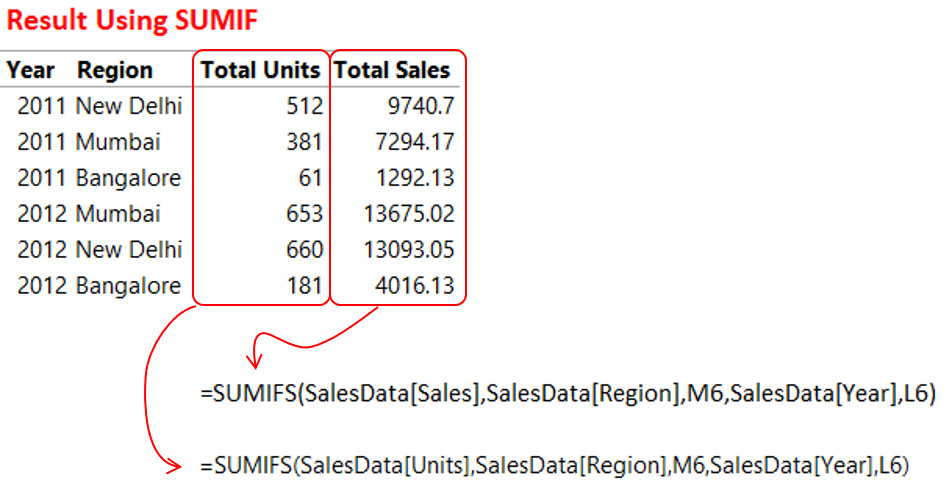
and I would have to write a SUMIF formula (or may be create a pivot) to be able to summarize Total Sales and Total Units as per Year and Region. The result would look something like this..
Doing a SUMIF in Power Query
In Power Query the equivalent of SUMIF is the “Group By” Feature in the Transform Tab. By using this feature you can not only do a SUMIF but also other IF based aggregations like COUNTIF, MINIF, MAXIF, AVERAGEIF, DISTINCTIF
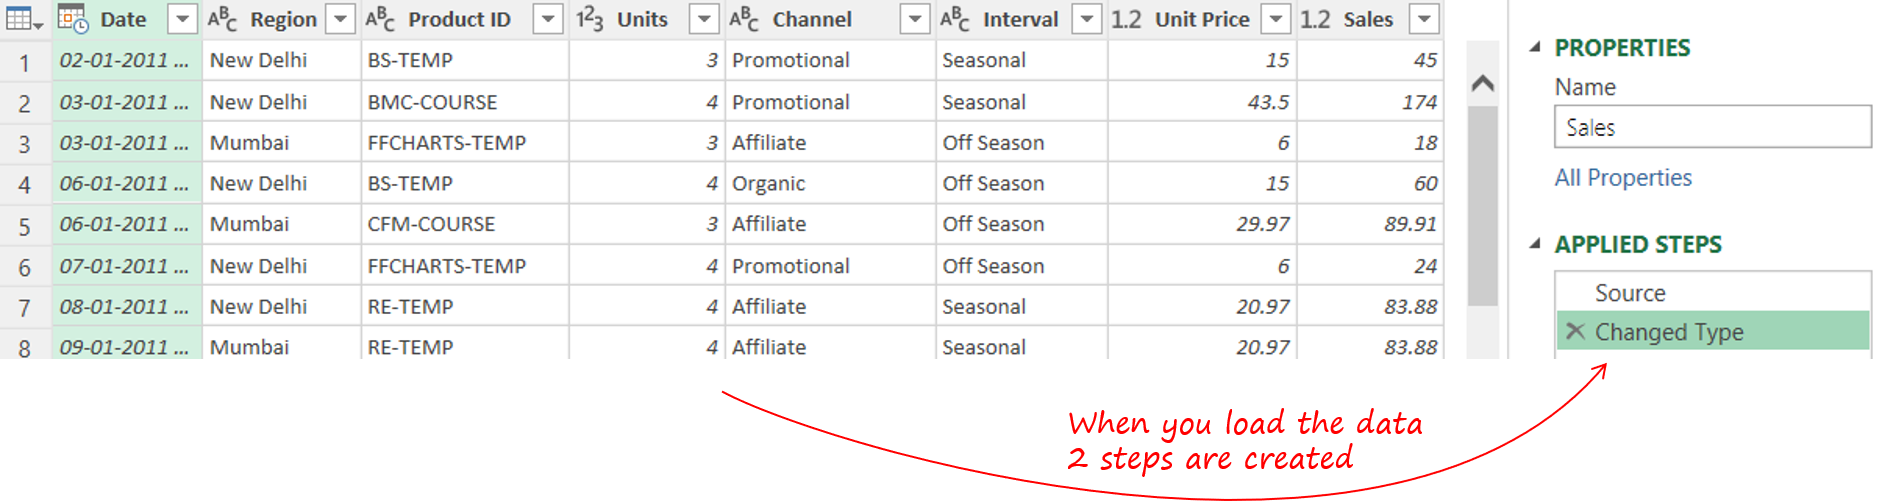
Let’s load the Sales Data in Power Query and get started
Now since I would like to summarize the data by Year and Region. I would have to extract the Year from the Dates. To do that
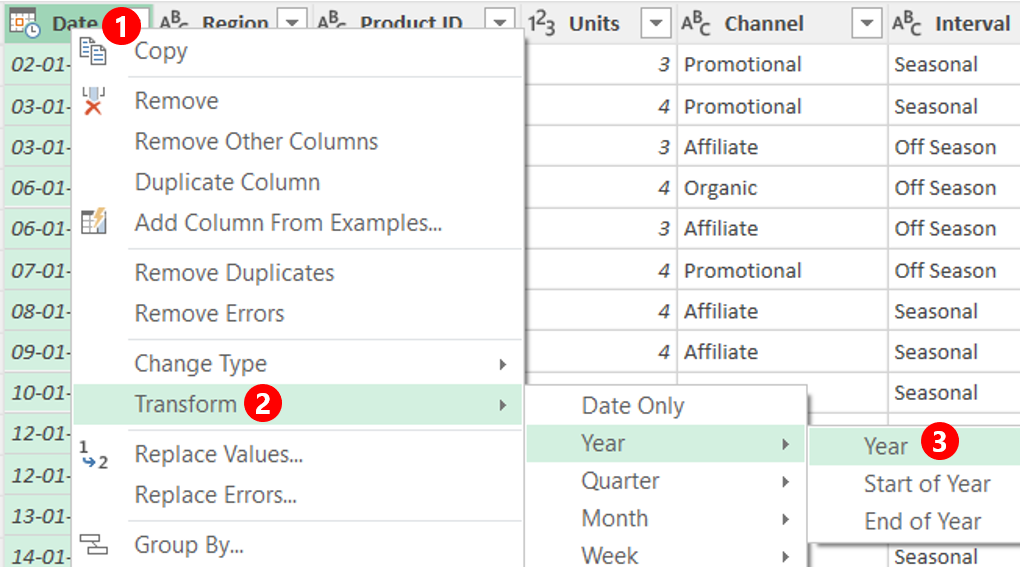
- Right click on the Dates column
- Go to the Transform Option
- Pick the Year
- You’ll see that the Dates have been transformed into Years
Now that we have both the fields (years and regions) we can use the Group By Feature a.k.a SUMIF
- In the Transform Tab go to Group By
- In the group by box, group it by Year and Region
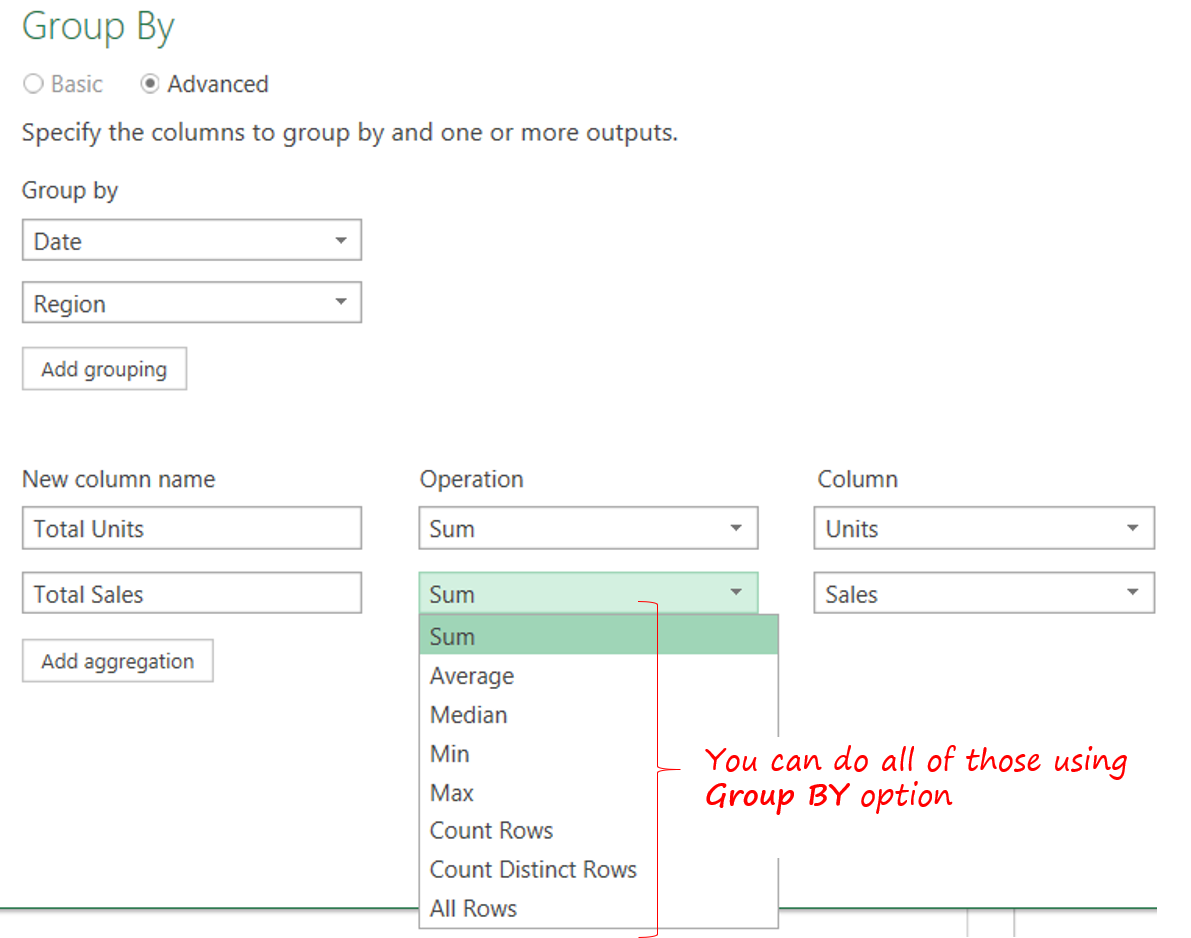
- Underneath you’ll have the options to create 2 new columns (calculations). For Total Sales and Total Units
- Provide the new column a name, pick the operation (sum, count etc..) and select the column
- We’ll have to do this twice since we need 2 columns (Total Sales and Total Units)
- That’s it SUMIF is done. Close and Load the data in excel
The power query result that you see (in gif above) is that same that we calculated using SUMIF
Doing COUNTIF other aggregations in Power Query
If you noticed carefully, while selecting calculations in Group By, it allows you to choose between aggregations like COUNTIF, AVERAGEIF, MAXIF, MINIF and even DISTINCTIF.
This is so cool!
Using Group By to calculate Percentage % of Total
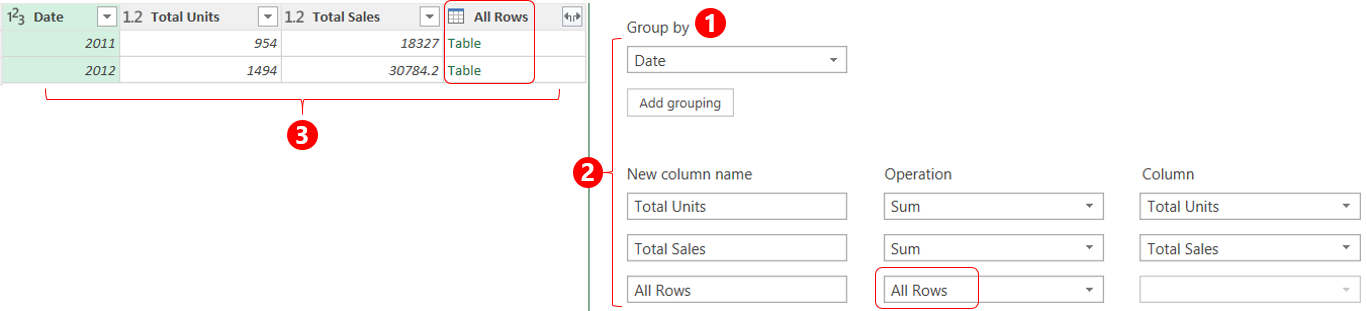
Until now all of what I have shared with you is the standard application of Group By Feature. Using the same I can also calculate % of total by using “All Rows” (which we din’t speak about)
But before I proceed I want to give you a glimpses of what I am trying to achieve. I would like to calculate % contribution of each region in the entire year for both Total Sales and Total Units
If it were excel, I would have done something like this..
Let’s start again from where we left our last query. I am going to duplicate the query (right click on the query and choose duplicate) and work further on it
- Now that we have an All Rows (expandable) Column, let’s expand that and get the figures for Units, Sales and Regions
- We can now simply create 2 Columns by dividing each Unit and Sales by their Totals
- In case you would cleanse this further, you may now choose to remove the Total Columns (for units and sales)
- And boom we have the % of Total Calculation Ready!
Wanna watch a Video Instead ?
More Power Query Tutorials
- How to do a Vlookup in Power Query
- Creating a Pivot Table in Power BI
- Create a Sheet Index using Power Query
- Unpivot Data with 2 Headers using Power Query
- Find Duplicate Vlookup Values using Power Query
- Merge Data from Multiple Excel files into a Single File
Automate repetitive data cleaning tasks using Power Query
A comprehensive course to learn Power Query to automate all your mundane and repetitive data cleaning tasks in Excel or in Power BI
DOWNLOAD THE COURSE OUTLINE | ENROLL IN THE COURSE