You’d almost always run into an allocation problem while creating profitability analysis. To be able to make sense of all the upcoming DAX, consider this business story!
Start with a Video?
A Business Case!
- A company sells many SKUs under 2 broad categories – Bikes and Accessories.
- To be able to calculate Gross Profit for each SKU the calculation is straight forward = Total Sales for each SKU – Cost of Goods Sold for each SKU.
- Now there can some expenses which are done for all SKUs in a Category.
- The Allocation Problem – to be able to calculate Net Profit for each SKU, you’ll need to allocate the expenses to each SKU in a certain ratio.
In this post, I’ll share how can you do dynamic allocation calculation in Power BI.
Consider this Data
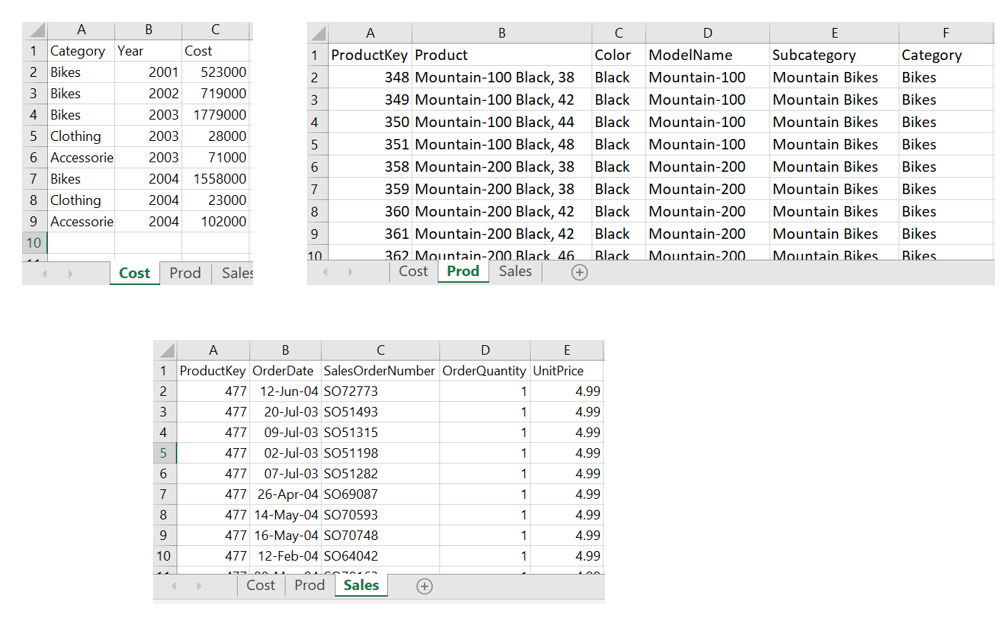
- The Cost table has the cost incurred per year for each product category.
- The Product table contains the standard product dimension columns.
- The Sales table contains the transaction details.
The relationships are pretty straight forward
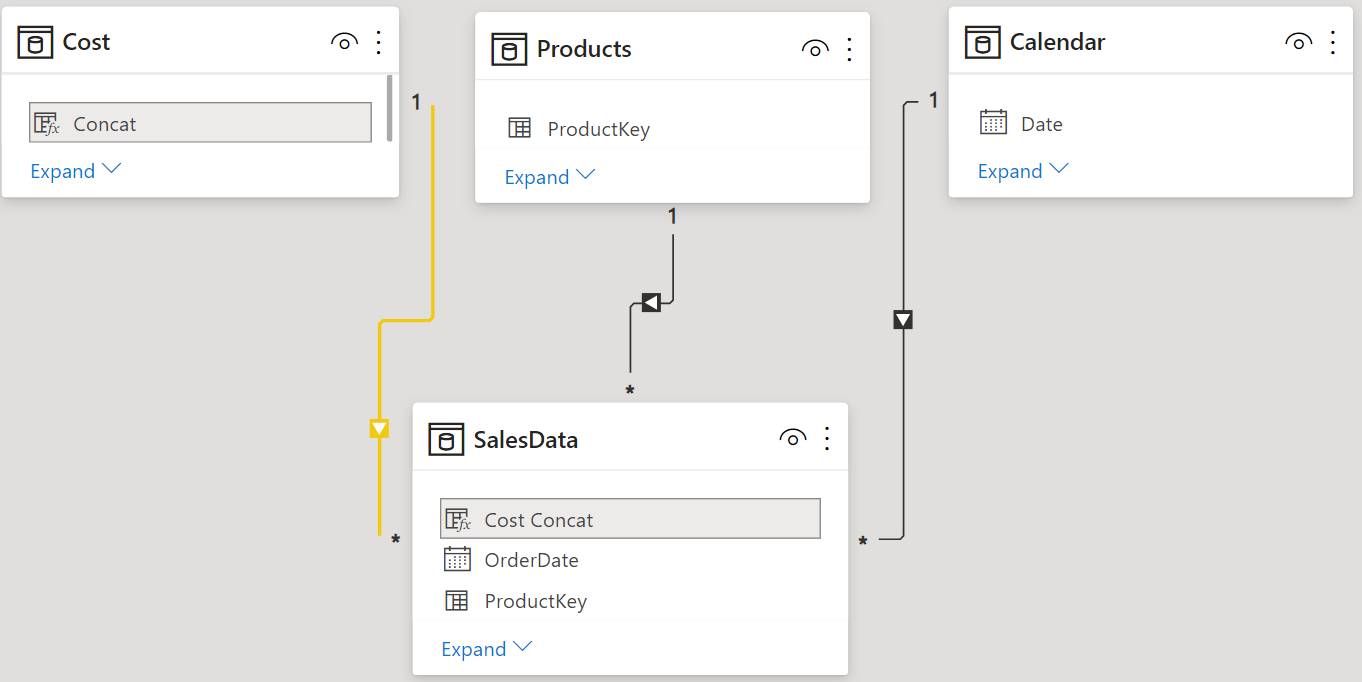
A little quirk about Sales and Cost Relationship – I created a Concat column in both the tables – Sales and Cost. This allows me to allocate the cost in the ratio of total sales for each row in the Sales Data
Cost Concat = YEAR(SalesData[OrderDate]) & '|' & RELATED(Products[Category])
Concat = Cost[Year] & '|' & Cost[Category]
Allocation Calculation Logic
The logic for allocating costs in the sales ratio goes something like this.
- Sales Ratio = Sales in each Row / Yearly Total Sales of Product Category
- Allocated Cost = Total Cost for Category for the Year x Sales Ratio
Once you understand the logic, this DAX measure isn’t that complicated
Cost Allocated =
SUMX (
    SalesData,
    DIVIDE (
        SalesData[UnitPrice] * SalesData[OrderQuantity],  -- Each Row Sales | Numerator
        CALCULATE (                                       -- Yearly Total Sales by Category | Denominator
            [Total Sales],
            ALLEXCEPT (
                SalesData,
                SalesData[Cost Concat]
            )
        )
    )
        * RELATED ( Cost[Cost] )                          -- Multiplied with Cost per Year for each Category
)
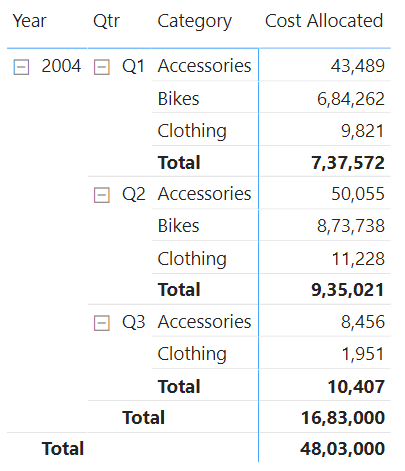
Let’s now take a look at the results. This allows me to drill down till the transaction level. Sweet
Optimizing Allocation Calculations for Performance
The only problem with the above measure is that it is going to slow down on a large data set. Why – especially because of the denominator, since we are recalculating the denominator for each row of the Sales Table.
One way to drastically speed up the calculation is to freeze the denominator as a calculated column in the cost table. Yes I am aware that I am suggesting to create a column but that won’t blow up the memory size, since we are creating that in the dimensions (cost) table.
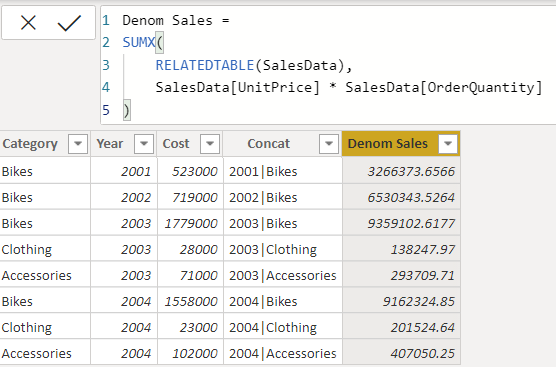
Denom Sales =
SUMX(
    RELATEDTABLE(SalesData),
    SalesData[UnitPrice] * SalesData[OrderQuantity]
)
Now that we have the Sales Denominator pre-calculated as a column all we need is a simple vlookup. Take a look at the revised measure
Cost Allocated Optimised =
SUMX(
    SalesData,
    DIVIDE(
        SalesData[UnitPrice] * SalesData[OrderQuantity],   -- Numerator
        RELATED(Cost[Denom Sales])                         -- Denominator
    )
      * RELATED(Cost[Cost])
)
Turns out, this makes the calculation 5x faster.
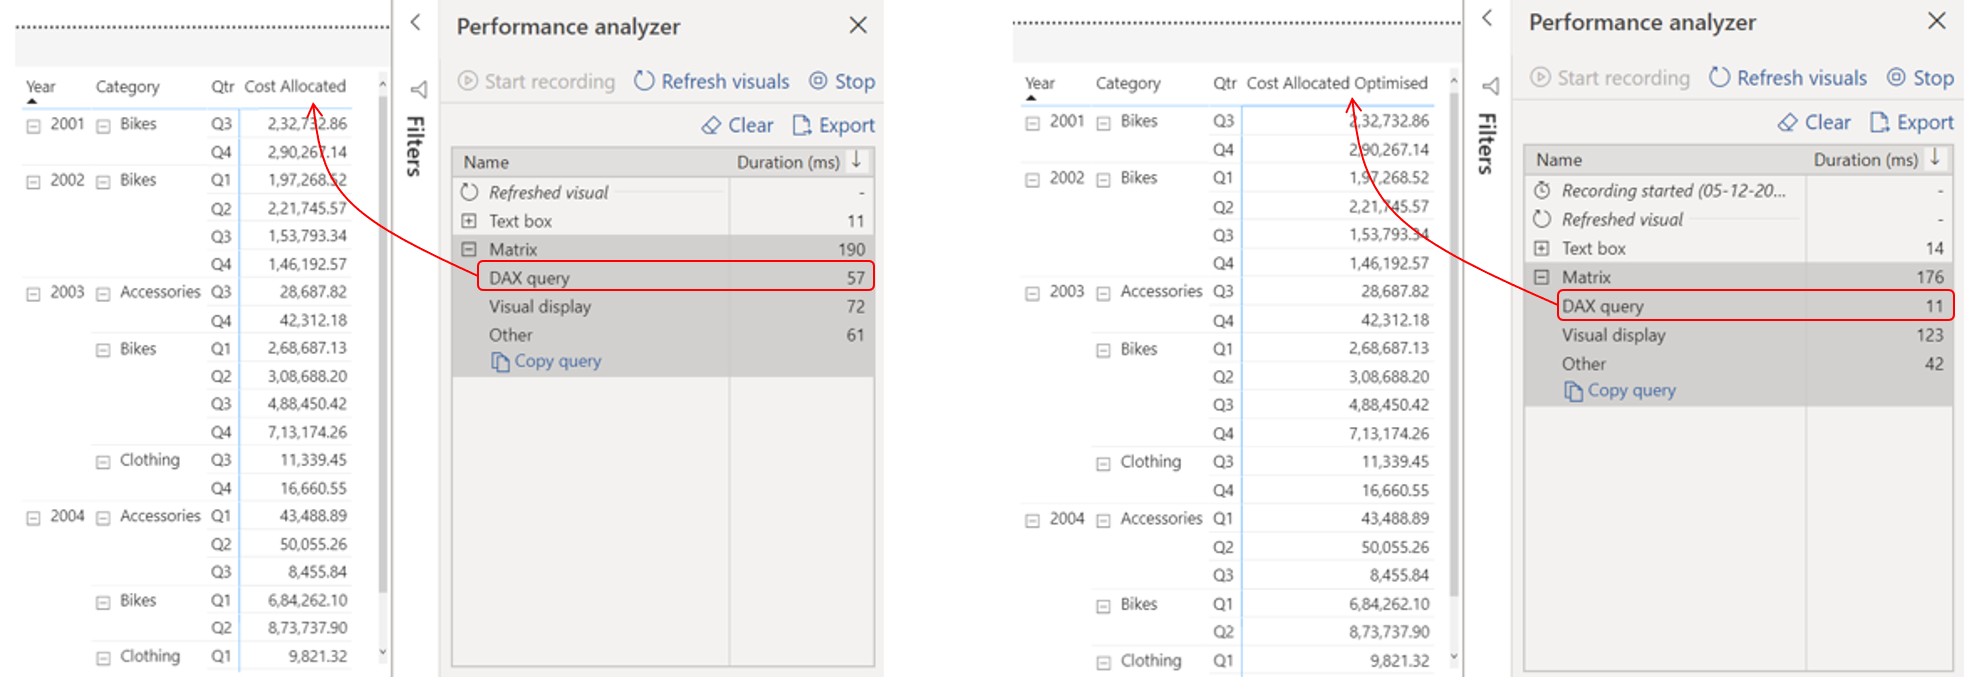
Now there could be many ways to perform allocations, you can modify this pattern to suit your case!
More on Power BI Calculations and Patterns
- Weighted Average Calculation in Power BI
- Calculating Percentiles in Power BI
- Running total for Dates and Non Dates
- Slab / Tiered Calculations
- Top Product Analysis