Slabs or tiered calculations are a pretty common while working with income taxes or commission rates but carrying them out using DAX can be tricky. In this post I am going to share with you one such example (with tweaks and variations) of how can you do slab or tried calculations in Power BI
Take a look at this data
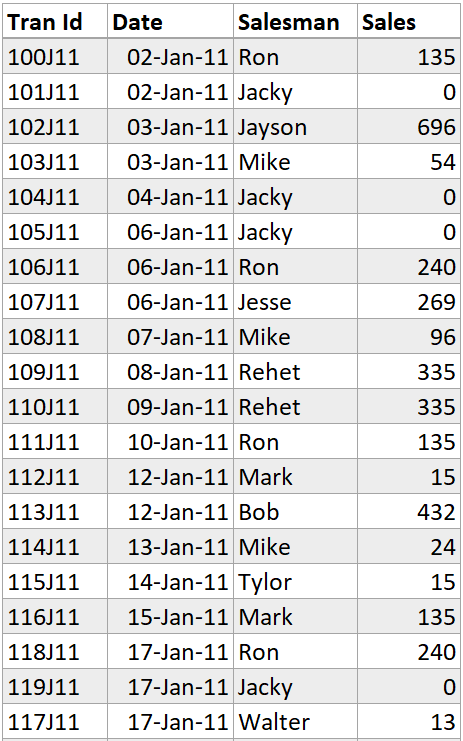
Transaction Level Sales Data by Salesman
And we have Commission Rate Table
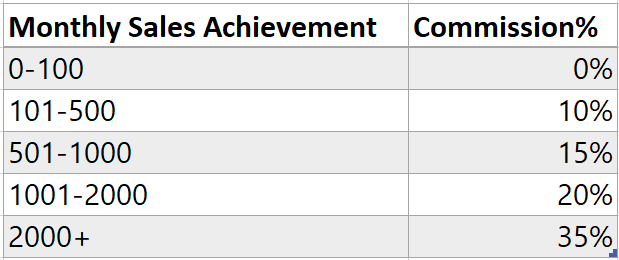
- The commission is paid based on Monthly Sales achieved by each Salesman
- The slab is progression based. e.g. If the Sales of Ron are $900 for Jan
- He’ll get no commission for $100
- He’ll get 10% of $400 (based on second slab) = $40
- He’ll get 15% of next $400 (based on second slab) = $60
- His total commission = $100 ($40+ $60)
- If you work with these calculations you get the idea!
Let’s see if we can create a robust DAX measure for calculating slab wise commission.
Relationships and a few transformations
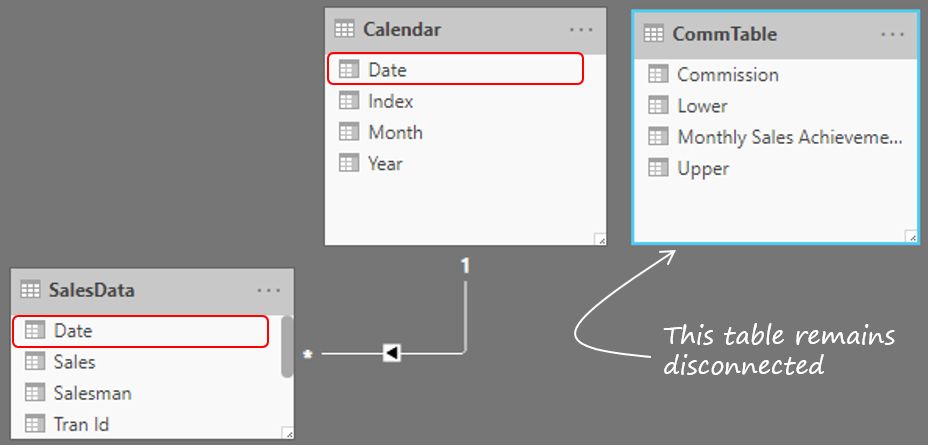
All tables loaded in Power BI, this is how the Relationships are setup between the Sales Data and Calendar (date table)
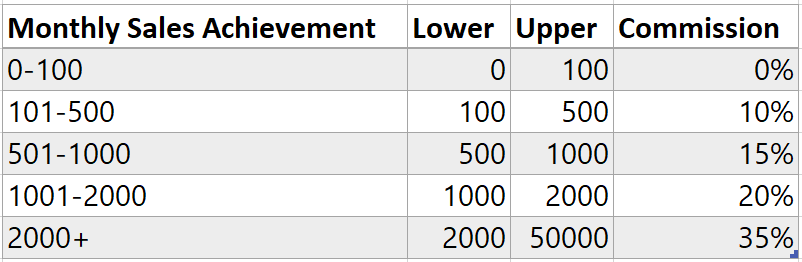
I also did some minor transformations in Comm Table. This is how it looks. Notice the upper and lower values are over-lapping (that’s done intentionally)
I also created a simple measure for Total Sales
Total Sales = SUM(SalesData[Sales])
Creating a Summarized Table
- If you noticed, we have transaction level sales data but the commission calculation will be done based on monthly sales achieved by each salesman.
- Even if we have only Year displayed (in a pivot) our measure should still calculate based on Monthly Sales for each Salesman.
Keeping the above in mind I first create summarized table – that’ll first summarize transactional data by Year, Month and Sales Rep. Consider this half cooked measure
Commission =
VAR MonthlySalesTable =
    ADDCOLUMNS(
        SUMMARIZE(
            SalesData,
            'Calendar'[Year],
            'Calendar'[Month],
            SalesData[Salesman]
        ),
        'Monthly Sales',
        [Total Sales]
    )
RETURN
    COUNTROWS(MonthlySalesTable)
I have also added a column using ADDCOLUMNS which calculates Total Sales for each row in the summarized table. As of now the measure only gives the count of the summarized rows.
Quick check..
- The max row count for any year can be 144 rows (12 months x 12 unique Salesmen)
- But it could be less too, since there could be months in which some Sales Rep sold nothing at all. (so if no sales = no record in the sales table)
If I drag this half cooked measure against the year, here is how it looks
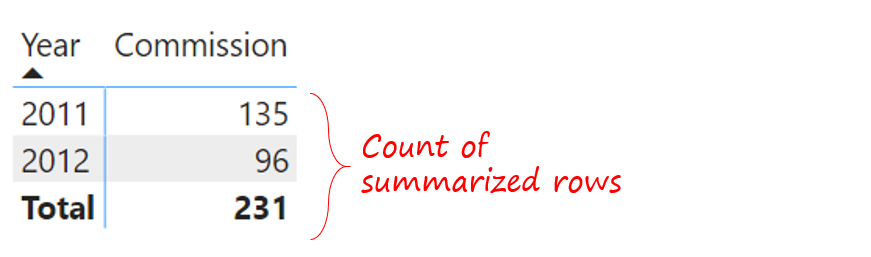
Seems in line.. lets proceed
Logic for slab wise calculation
It would be hard to explain in words, so consider this back-of-the-envelope calculation
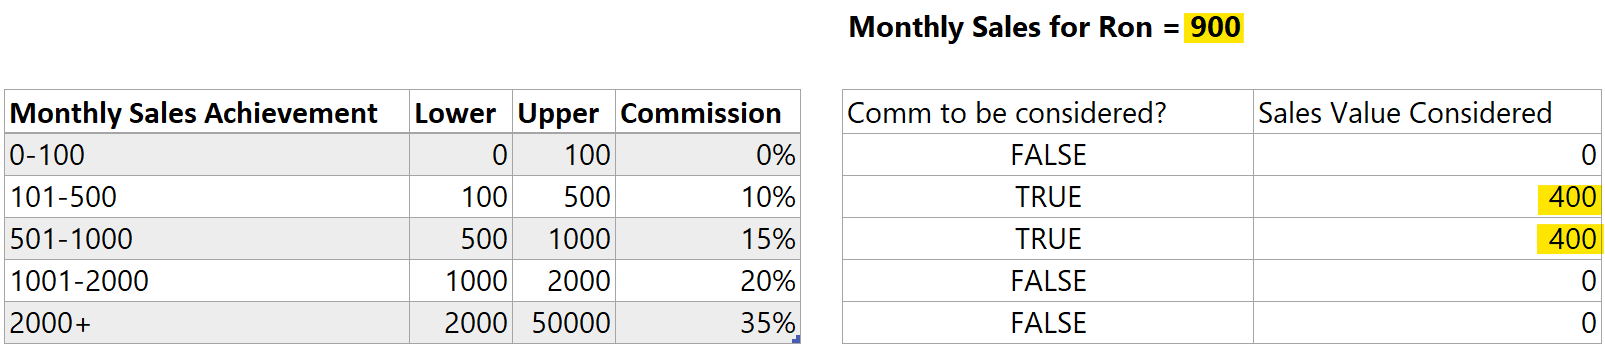
- We come back to RON whose monthly sales were 900.
- In the 1st slab (for the first $100) he won’t get any commission.
- In the 2nd slab he’ll get the commission on $400 (upper – lower i.e. 500-100). Makes sense right!
- In the 3rd slab he’ll again get commission on $400 (900-500 i.e. total sales – lower).
Notice a few things
- I find the Sales Value for commission = (Total Sales – Lower) – (Total Sales – Upper)
- I adjust for the above for negative values if any
- I then multiply Sales Value for Commission by Commission Rate%
- And this repeats row by row, for each salesman, each month.
Slab wise calculation measure
Now let’s complete our measure. Adding the red part to our previous code.
Commission =
VAR MonthlySalesTable =
    ADDCOLUMNS(
        SUMMARIZE(
            SalesData,
            'Calendar'[Year],
            'Calendar'[Month],
            SalesData[Salesman]
        ),
        'Monthly Sales',
        [Total Sales]
    )
RETURN
    SUMX(
        MonthlySalesTable,
        VAR CurrentRowSales = [Monthly Sales]
        RETURN
        SUMX(
            CommTable,
            VAR CurrentUpperBound = CALCULATE(MAX(CommTable[Upper]))
            VAR CurrentLowerBound = CALCULATE(MAX(CommTable[Lower]))
            VAR SalesValueForCommission =
                MAX(CurrentRowSales - CurrentLowerBound, 0)-
                MAX(CurrentRowSales - CurrentUpperBound, 0)
            RETURN
                SalesValueForCommission * CommTable[Commission]
        )
    )
I know it looks intimidating but if you understood the logic above, you’d understand the explainer story.
Using SUMX
- I do calculation for each row of the Summarized Monthly Sales Table.
- And since my Comm Table is not related to any other table so when I loop another SUMX for comm table, I get to work with all the commission slabs row by row without any filter context.
- And for each commission slab, I follow the same logic as above.
Slightly tricky but worth it (you still with me?)
Now consider 3 different pivots, the results look so pretty 🙂
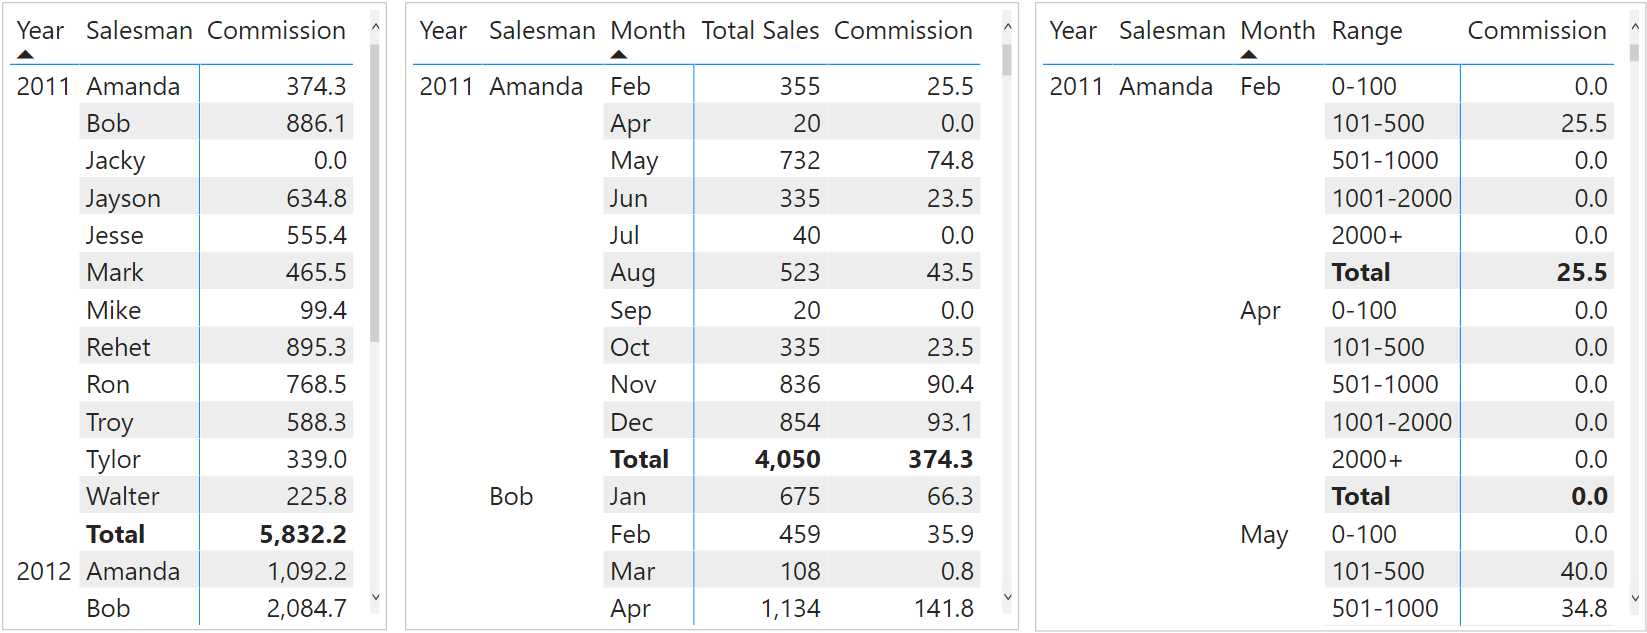
Couple of things..
- If you see this calculation at granular level deeper than the month level (may be day level) this would give you a wrong answer.
- In that case, you’ll probably have to use HASONEVALUE to turn off the day level calculation.
If you still haven’t understood any of what you’ve read, I totally understand your frustration, DAX can be tricky. If you need help, hit me up in the comments. I’ll be happy to help.
More on DAX Calculations
- A similar post from Power Pivot Pro
- TOP selling Product Analysis using DAX
- Least selling Product Analysis using DAX
- Financial Year Calculations
- Adjusted SamePeriodLastYear Calculations
- Actual v/s Budget Calculation Patterns