
Before I start writing this gigantic post, I need you to imagine your analysis greedy pestering boss (acronymised as AGPB :D), who always has one more question after you submit your report.
AGPB has assigned you to do some analysis on Top Selling Products. Given his nature, after you submit your analysis, he’ll obviously have one more question which will keep you at work post 6 pm.
In this post let’s take AGPB down! Ready ?
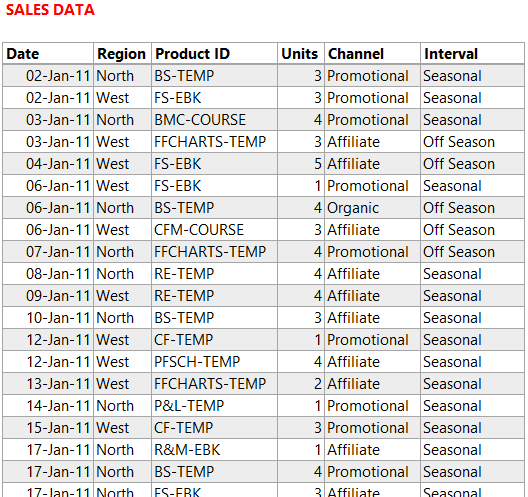
Assume that you have this Data
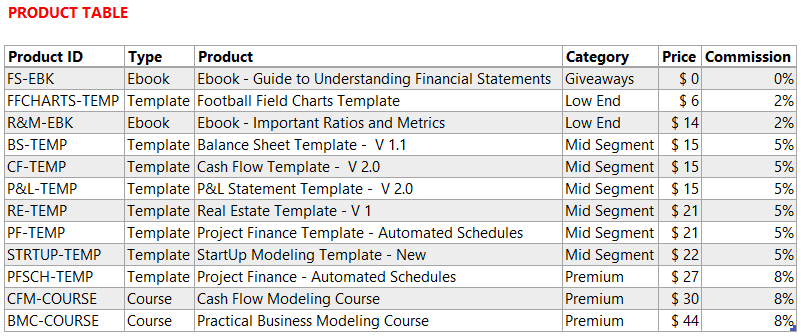
To begin with let’s find the Total Sales – If you going the excel way, you’ll have to write a VLookup to get the price (from products table) and then multiply it with units (in the sales table) to get Total Sales.
Although you can also do a VLookup in PowerPivot to find Sales, but let’s not do that because adding additional columns is not smart. The smart thing is to write a DAX Measure
Total Sales =
SUMX ( Sales, RELATED ( Products[Price] ) * Sales[Units] )
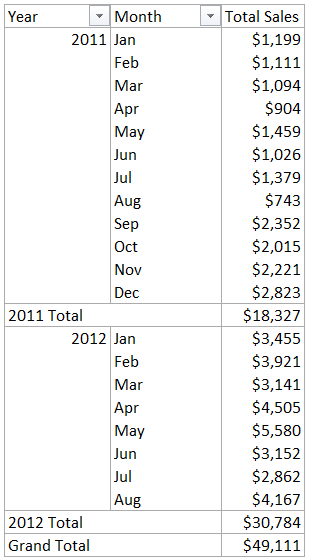
Creating a Pivot with years and months on the rows and Total Sales Measure in values, I get this
Quick note – I have established relationships between
- Sales and Product Table (Product Id being the unique column)
- Sales and Calendar Table (Date being the unique column)
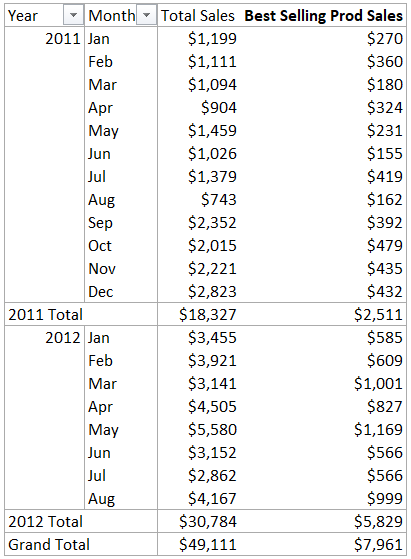
Analysis #1 Now that we have Total Sales. Let’s get the sales for the best selling product.
Best Selling Prod Sales =
MAXX ( Products, [Total Sales] )
Quite simple huh! Now you take this pivot to AGPB and as his name suggests, pat comes the question – Hey can you also tell me the best selling product name ?
Well, if you see it’s quite a legit question! But how the hell can we make the names appear ? Let’s make another interesting measure
Analysis #2 Let’s find the Name of Best Selling Prod. Here comes the DAX
Best Selling Prod =
FIRSTNONBLANK ( TOPN ( 1, VALUES ( Products[Product] ), [Total Sales] ), 1 )
And you drag this into your Pivot, here is what you get!
(Damn this is awesome. In case you are new to Power Pivot, you (or even your AGPB) wouldn’t have seen product name (text) appear in the values area of the Pivot. I learnt this technique from Rob Collie)
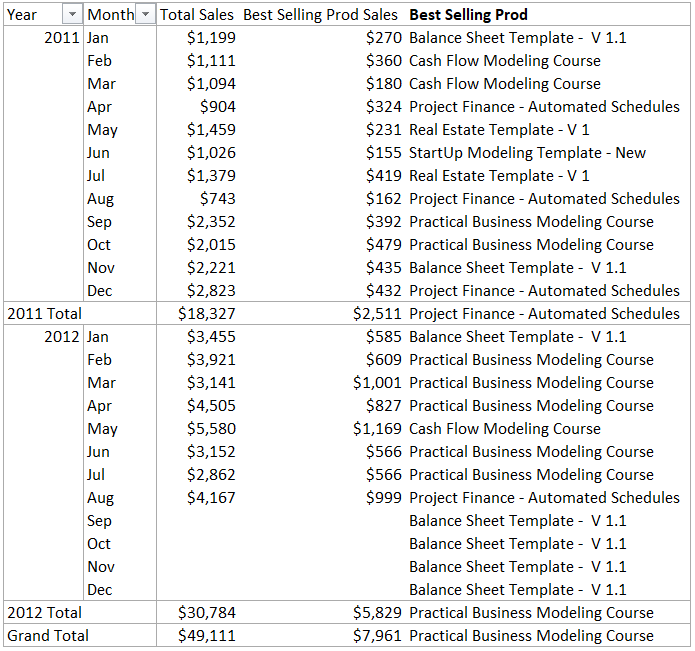
And since we have sales data only until Aug 2012, let’s wrap this measure around IF to stop calculating after Aug 2012. So the revised measure becomes
Best Selling Prod =
IF (
[Total Sales] = BLANK (),
BLANK (),
FIRSTNONBLANK ( TOPN ( 1, VALUES ( Products[Product] ), [Total Sales] ), 1 )
)
The greed rises and you are held back on the account of
- Finding the Sales of Top 3 Selling Products
- And may be their names too!
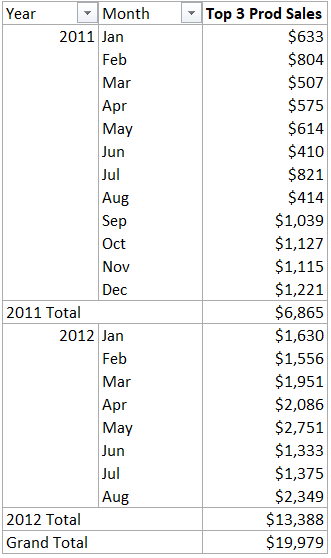
Analysis #3 & 4 – Let’s first find the Top 3 Prod Sales
Top 3 Prod Sales =
SUMX ( TOPN ( 3, Products, [Total Sales] ), [Total Sales] )
We use the same TOPN formula for taking total of 3 best selling products. Easy Stuff! And the Pivot looks like this
Now comes the tricky part. We used FIRSTNONBLANK to get the name of a single product but how do we get name of 3 Best Selling Products. Here comes the DAX
Top 3 Products =
IF (
[Total Sales] = BLANK (),
BLANK (),
CONCATENATEX ( TOPN ( 3, Products, [Total Sales] ), Products[Product], “, ” )
)
I love this one! It gives me a pivot never seen before 😀
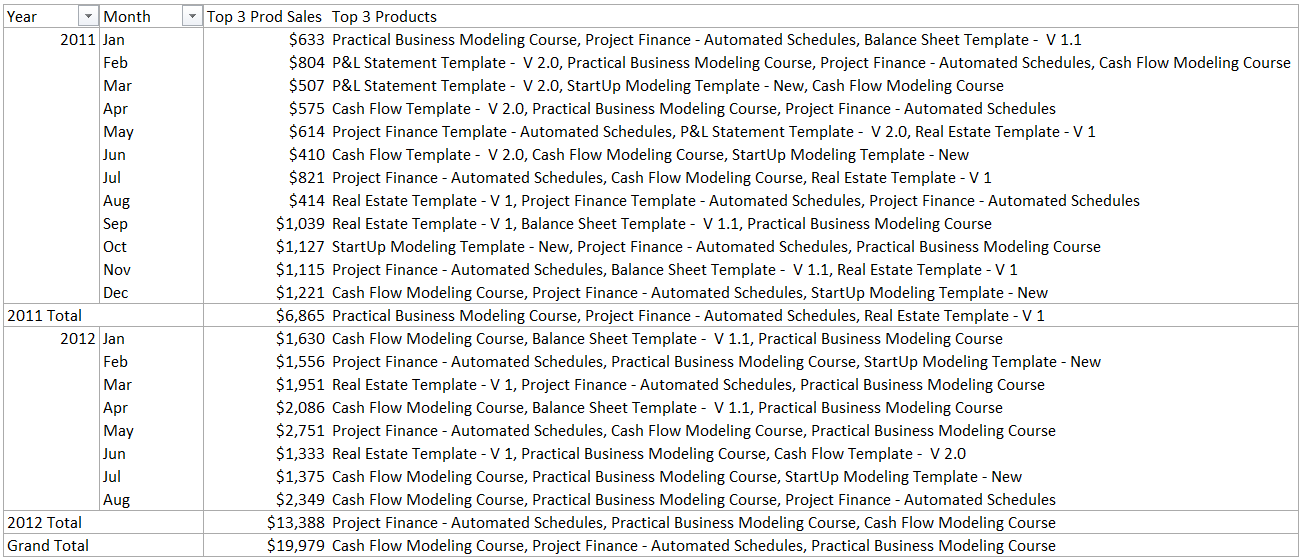
I am sure you and I can anticipate 2 additional (greedy) questions
- Can I get the name and sales of each product?
- The Pivot is getting too bloated can we have the product names in separate rows
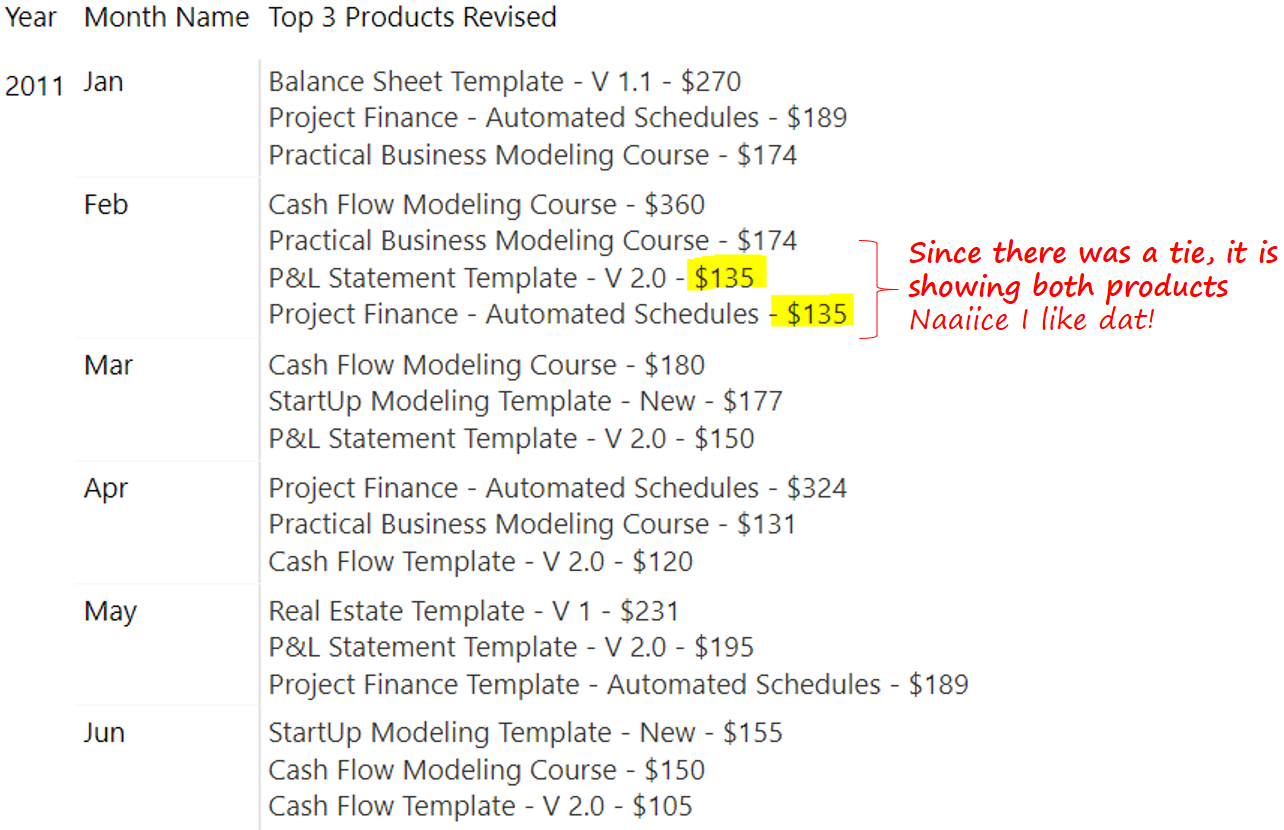
Analysis #5 – Let me show you the Power of DAX. Here come the revised measure
Top 3 Products Revised =
IF (
[Total Sales] = BLANK (),
BLANK (),
CONCATENATEX (
TOPN ( 3, Products, [Total Sales] ),
Products[Product] & ” – “
& FORMAT ( [Total Sales], “$0” ),
” | “,
[Total Sales], DESC
)
)
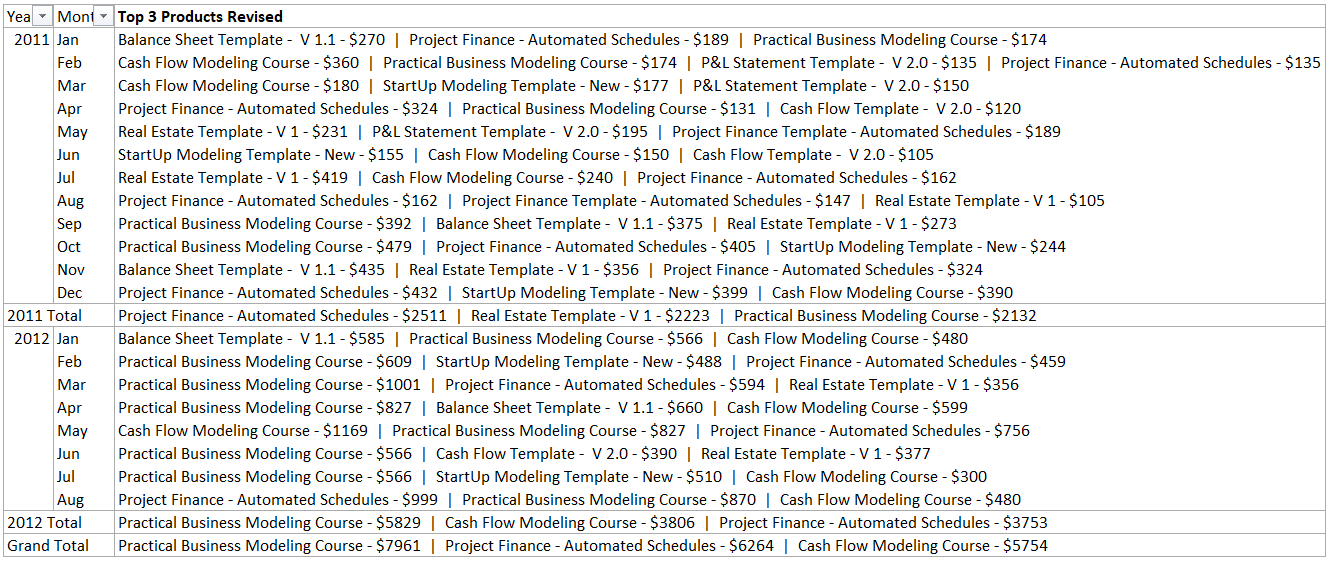
The only thing I wasn’t able to do was put product names and their sales in separate lines. Frankly I couldn’t find a way to do this in PowerPivot but if you are working with PowerBI you can revise your DAX measure and parse them into separate rows
Top 3 Products Revised (PowerBI) =
IF (
[Total Sales] = BLANK (),
BLANK (),
CONCATENATEX (
TOPN ( 3, Products, [Total Sales] ),
Products[Product] & ” – “
& FORMAT ( [Total Sales], “$0” ),
UNICHAR ( 10 ),
[Total Sales], DESC
)
)
Just changed the red part to UNICHAR. 10 is the ASCII code for enter 😎 Here is how it looks in PowerBI
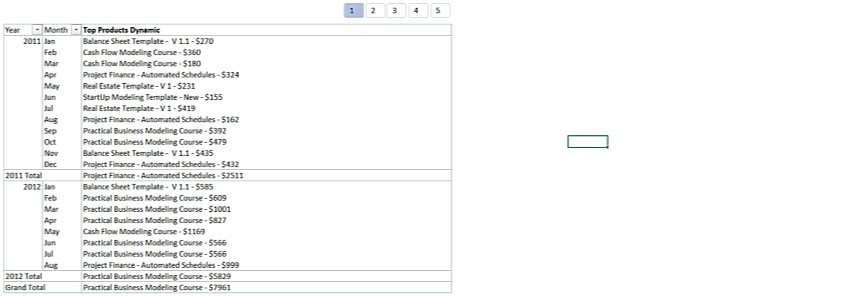
Analysis #6 – If the greed shoots through the roof, AGPB will ask you to make the TOPN dynamic. Where in he (or may be she) should be able to change TOP 3 to TOP 5 and back TOP 1 if he likes.
Let’s do that!
And for doing this we’ll be needing disconnected table with 5 values (1-5) on this disconnected table we’ll write a simple measure
NVALUE =
MAX ( TopTable[Values] )
Now let’s replace the manually written ‘n value’ with the NVALUE measure. I am writing a new measure
Top Products Dynamic =
IF (
[Total Sales] = BLANK (),
BLANK (),
CONCATENATEX (
TOPN ( [NValue], Products, [Total Sales] ),
Products[Product] & ” – “
& FORMAT ( [Total Sales], “$0” ),
” | “,
[Total Sales], DESC
)
)
After creating a slicer on the disconnected table the pivot would work like this
If you have stuck around until here, I am assuming you really need this :D. Let me know in the comments if you have any questions in implementing this analysis with your own data
More PowerPivot Dashboards and Reports
- Facebook Dashboard in Excel
- Indian Tech Startup Dashboard
- Vlookup in PowerPivot
- Interesting Pivot Table Problem
- Pivot Table Questions – Challenge