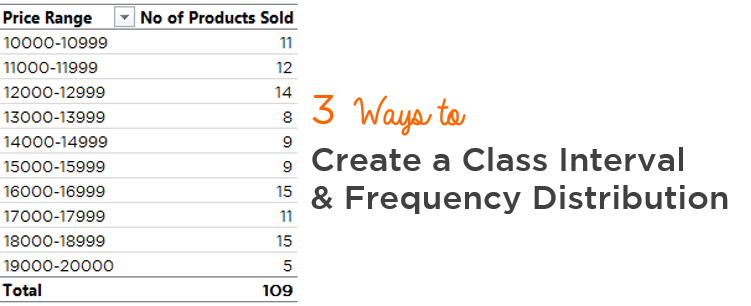
The word ‘Class Interval‘ takes me back to the math class in school. Trust me, I had a tough time understanding Class Intervals and Frequency Distribution jargons. Several years later (now) when I finally believe I have understood its meaning and application, I want to keep it really simple for you and talk about 3 different ways to create it in Excel
All English and no Jargons.. promise!
We’ll begin with a Simple Data set
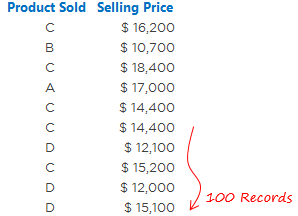
We have 100 transactions of products being sold. A typical question could be to create price bands to find how many transactions happened between each range. Something like this..
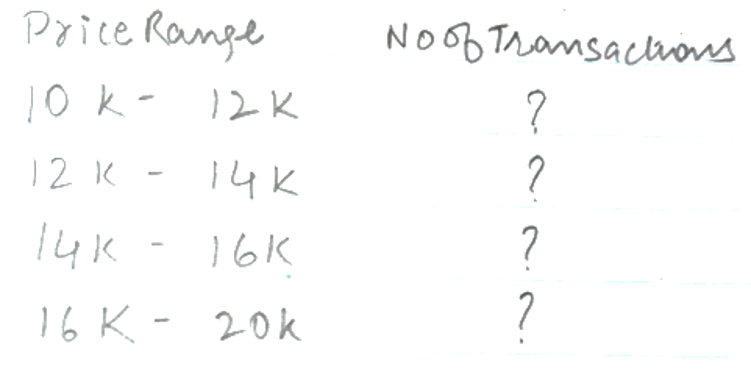
Let me show 3 different ways to do this
1. Pivot Table Method
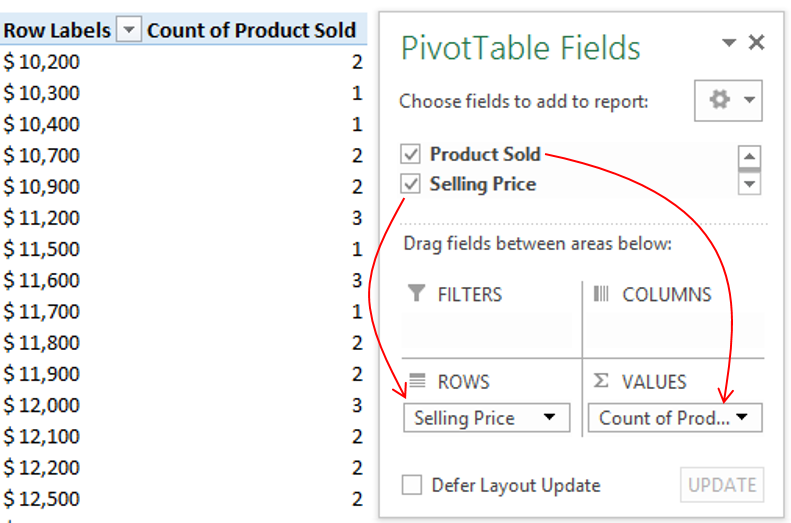
- Create a Pivot Table with the Data
- Drop Product Sold in Values
- Selling Price in Rows
Now let’s create price bands (class intervals)
We are going to use the grouping feature of Pivot Tables
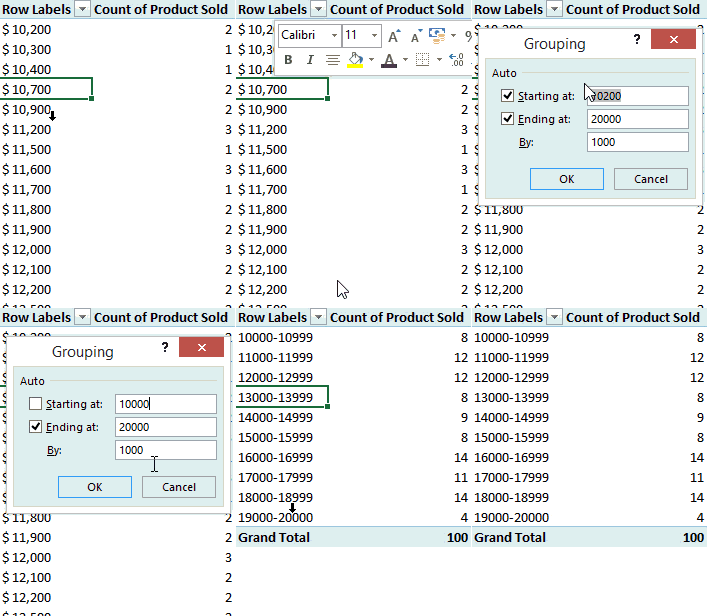
- Right click on Price and Choose Group
- Start at 10,000 and End at 20,000
- The increment of 1,000
And we are done!
2. The Frequency Formula
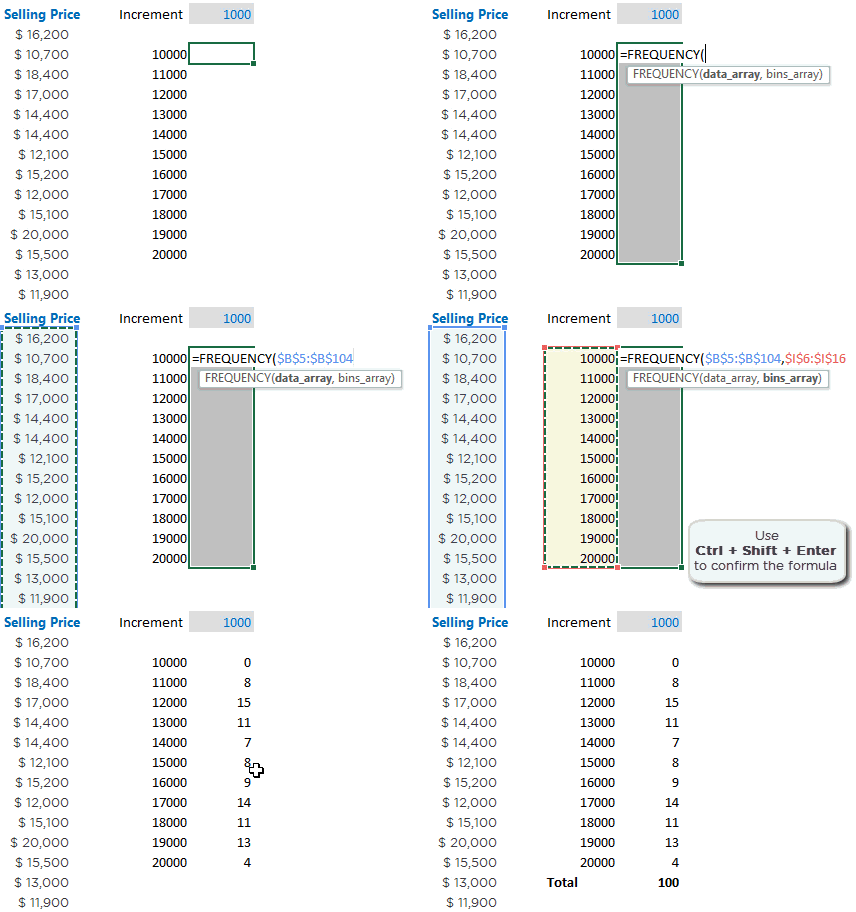
Please note a few things
- I am first selecting the range where the formula is supposed to be written. That is necessary because the formula is working on the entire range at once
- The Frequency Formula has 2 parts
- Data Array – Where the actual data lies. In our case it will be the Selling Price
- Bins Array – Think of Bins as price range buckets. I’ll talk about this in detail in a moment
- Since this is an array formula, use CTRL SHIFT ENTER to confirm the formula
- Take a note that 100 records tally with the total
If you compare the results of the Frequency Formula with Pivot Table the results, they will vary a bit. For instance the values between 11k – 11,999 are not same as 12k range in frequency formula
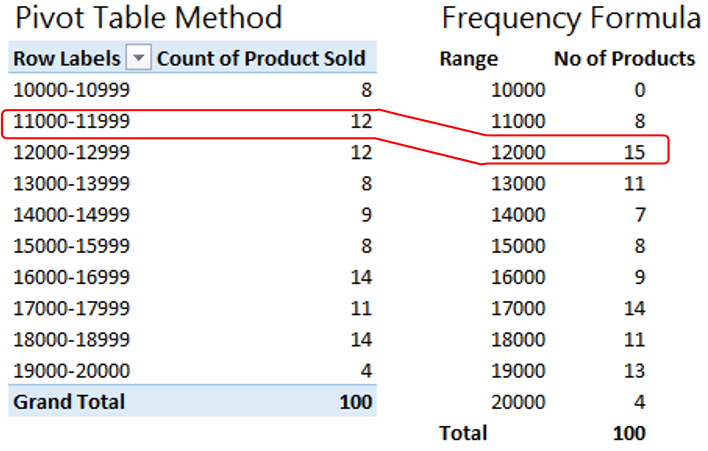
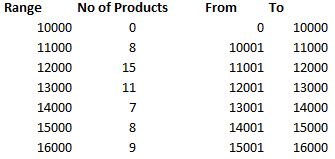
This is how the frequency formula reads the ranges and that is why the results vary a bit
3. Countifs Formula
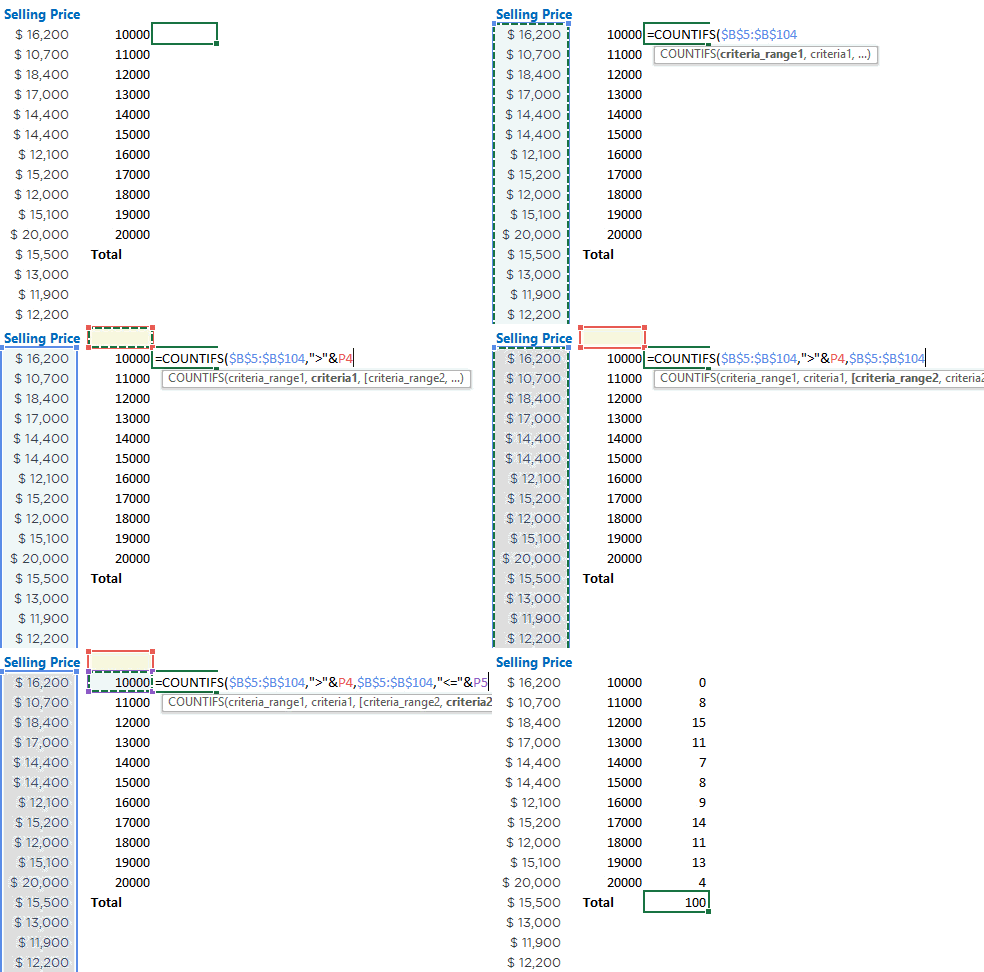
Note a few things
- The result of the Countifs formula is the same as Frequency Formula
- The criteria has been put in double quotes (” “) that is mandatory in the Countif/S function
DOWNLOAD EXCEL FILE WITH ALL 3 METHODS
Some more Excel Tips for you
- Rearrange (Unpivot) the data for a Pivot Table
- Extract Unique Values – 2 Methods
- Consolidate Data from Multiple Sheets
- Automate your Filter with a Macro
