The Grouping feature is a pretty awesome (and incredibly quick) technique to do time series (quarters, years, months or more types of) analysis with a couple of clicks. Also (over the years) I have realized that a lot of people don’t know about this. Nothing better than if you know it, If not then lets take a dive.. Shall we?
Consider this Data
4 yrs sales data [download here]
What if your boss email’s you (at 6 pm) that he wants to see a year on year quarterly performance in different regions?
You should ideally reply: No problem Sir, I would send that in a moment 😛 Now let’s finish this in a moment
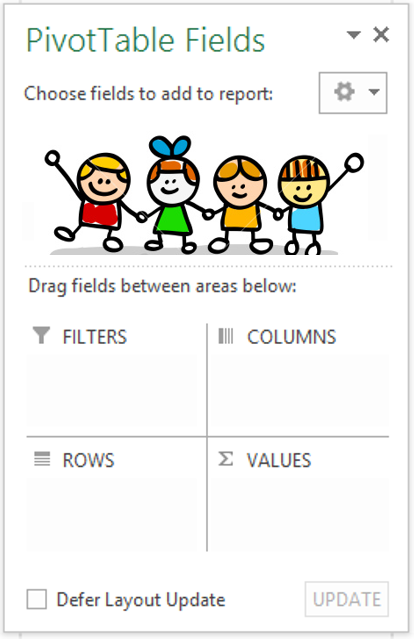
Let’s insert a Pivot Table
Now this is cool! We have summarized the data by regions but the dates need to be grouped in quarters and years. Until then our report is incomplete!
Introducing the Grouping Feature!
- Right click on the dates column and select ‘Group’
- In the dialogue box select the way you want to group the dates. As of now we pick Years and Quarters
- And BAM! there you go.. the dates get grouped in quarters, year wise!
It really took a moment, ins’t it ? 😆 Download the finished file from down below
Now its 6:02 pm, you can attach the report, click send button and a go home!! Cheers 😎
Also learn to create data models in Pivot Table [excel 2013 feature]
You can quickly cross analyse multiple data sets by setting up data models. All you need is