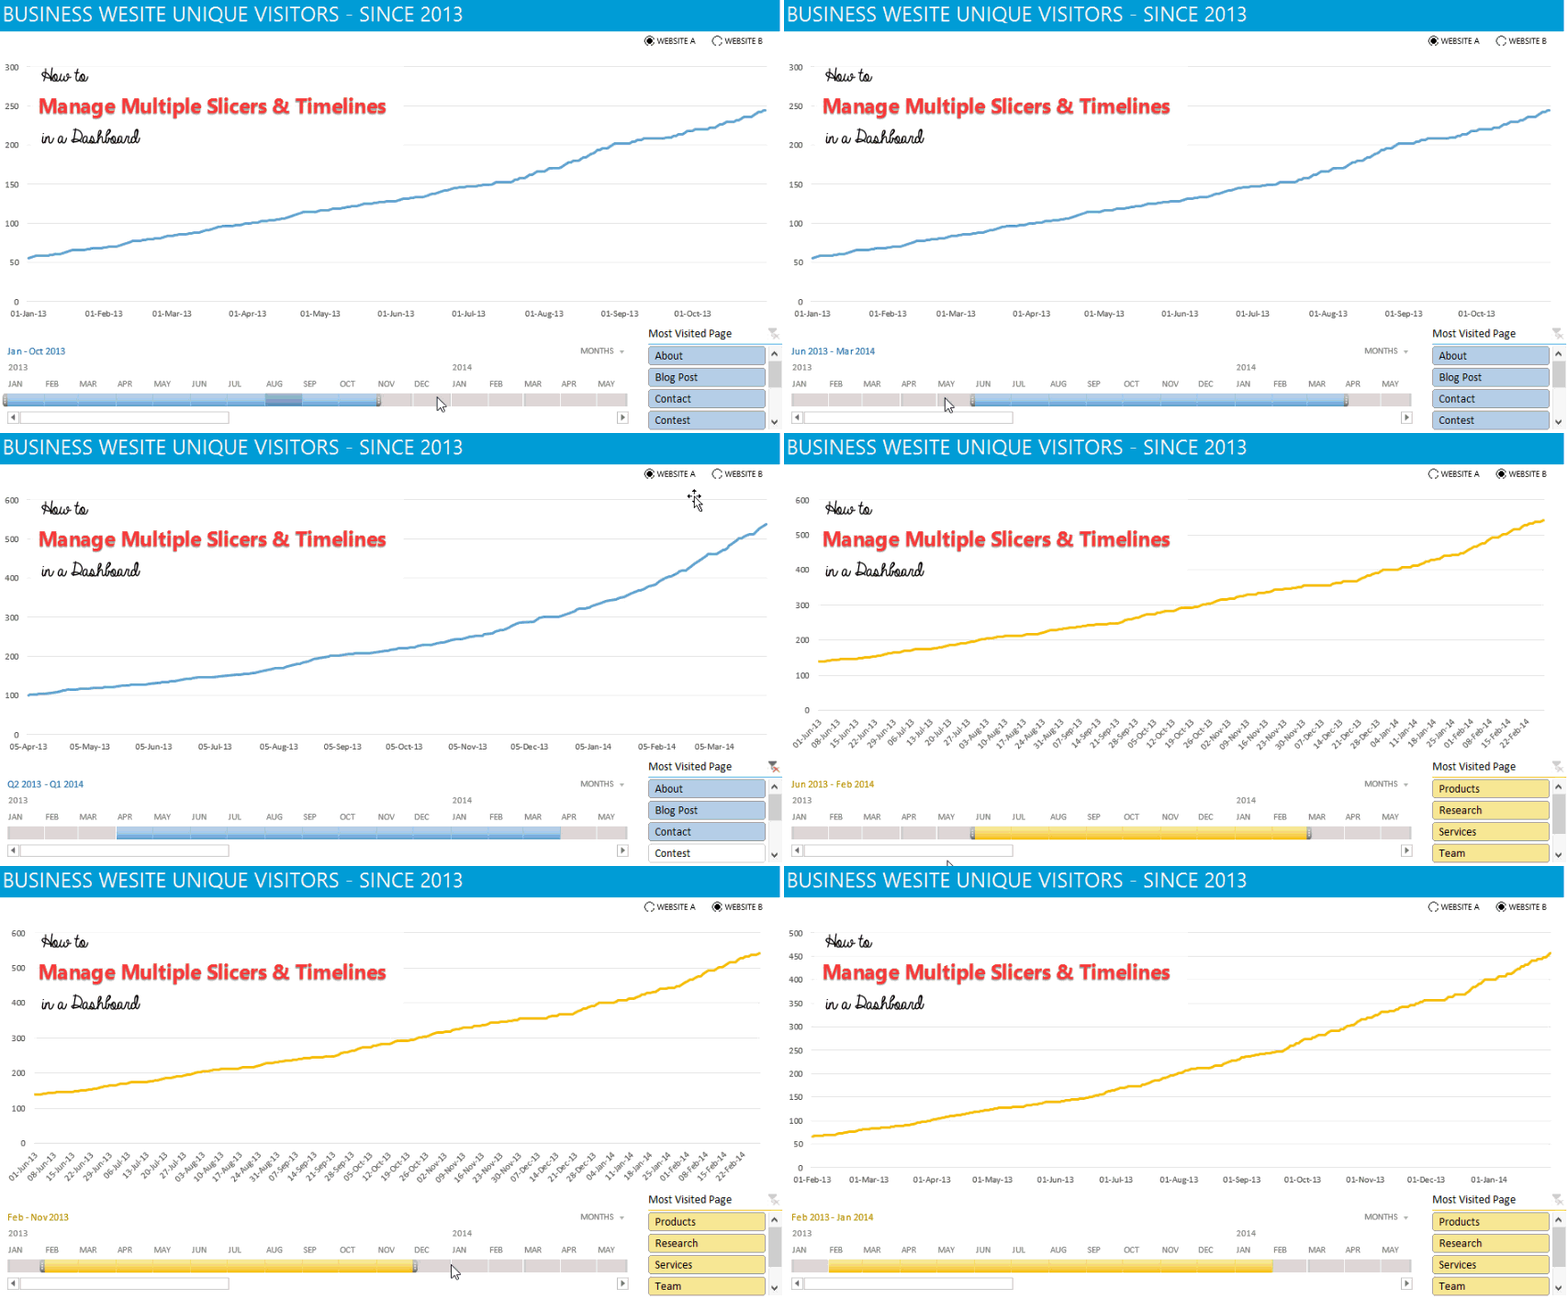
Very often while making a complex dashboard you would find yourself using multiple slicers to slice and dice the data in multiple ways. But the only drawback could be managing space to fit all of them on the screen!
Let’s see a smart work around for that
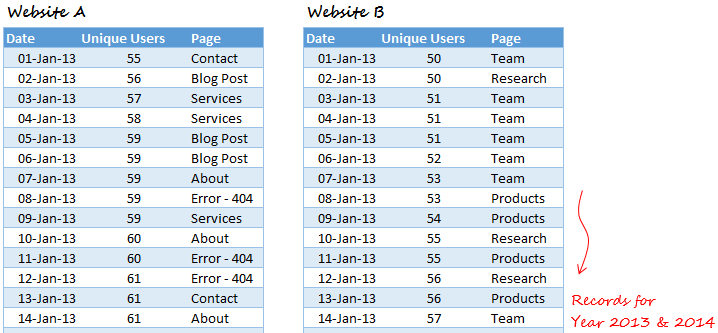
Assume this data for 2 business websites..

Nothing too significant – just 3 things – Date, Unique Visitors on the Most Viewed Page
Here is a video on how to manage multiple slicers..
The Code used in the Dashboard
Sub WEBSITE_A()
 ActiveSheet.Shapes.Range(Array('Page', 'Date')).ZOrder msoBringToFront
End Sub

Sub WEBSITE_B()
 ActiveSheet.Shapes.Range(Array('Page 1', 'Date 1')).ZOrder msoBringToFront
End Sub
You can change the text in bold and blue to the name of your slicers and can assign the macros to a button/objects
Other Formatting Tricks
- How to Beautify you Excel Reports
- 7 Tips to Instantly Beautify your Presentations
- Eight Chart Formatting Tips
