Last week I received an email and this is what it said..
This mail got me thinking of writing something exclusively on (how tos about) Dashboards. Just out of curiosity, I additionally reached out to a few people and asked them their biggest challenge for making quick and smart dashboard.
2 major responses popped up!
- “Chandeep, making a dashboard is difficult”
- “Chandeep, it’s time consuming”
So now I understand the problem. In this post I am going to solve both these problems and teach you to make simple and yet powerful dashboards in just 15 mins. And the good part is that the concept will apply on most data sets
The 15 Mins Dashboard Challenge..
To prove my point I took a personal challenge to make an insightful, beautiful and interactive Dashboard in 15 mins.
Now when I say 15 mins I am assuming 15 minutes of pure excel alchemy and not the pre-dashboard planning work. So let’s assume 15 more mins of that work so in total 30 mins for a completely ticked and tied Dashboard.. not bad huh?
Let’s Start
Take a look at this data
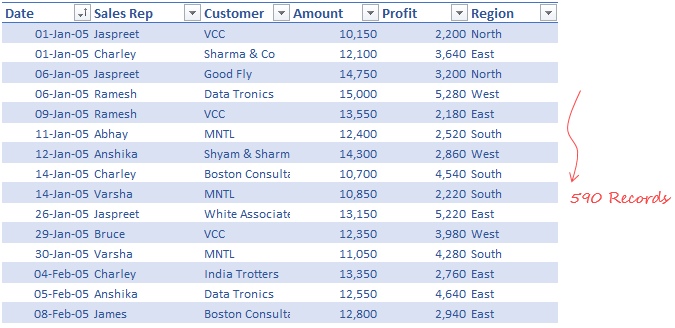
We have about 590 records
- Dates from year 2005 till 2008
- Sales Rep
- Customer
- Amount / Sales
- Profit
- Region
Dashboard Pre-Work : I just listed down key questions that I wanted to answer with the dashboard
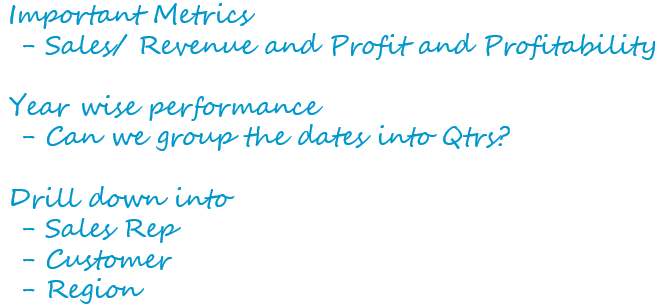
Took about 10 mins
Here is a Quick Dummy of the Dashboard
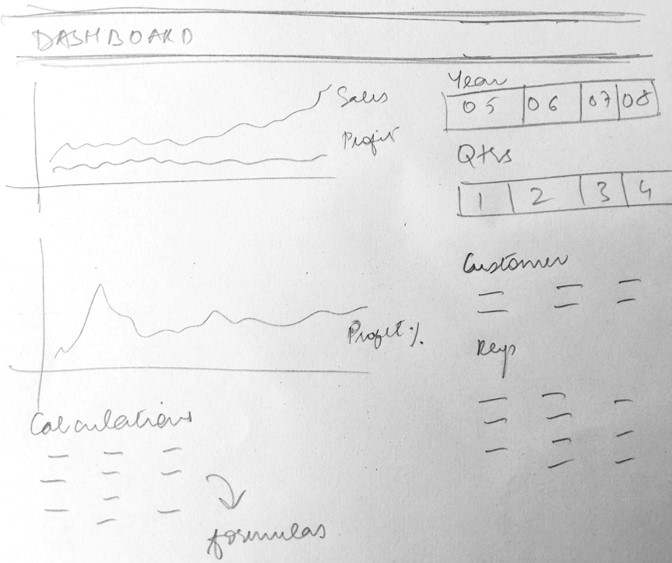
Took about 5 mins
Watch me live creating the Dashboard
Here are my start and end times
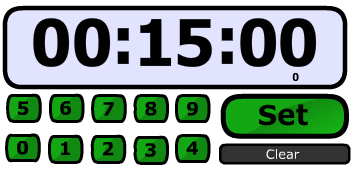 – Start
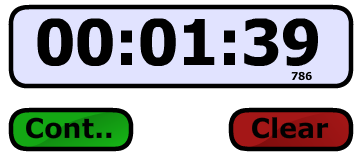 – End
– End
Resources
- A comprehensive guide to Slicers in Excel
- How to format Slicers
- Bonus Tip : How to Manage multiple slicers in the Dashboard
- Learn how tables can help you make your Vlookup Robust
- How to find the Year and Quarters
Now its your turn!
Drop in a comment
- For more ideas to make it more meaningful and interactive. Just keep in mind that it should be simple and quick
- How will you use the table and slicer technique in your existing work ?
Some more Simple Visualizations
- Use Drop Downs to make Chart Switches
- Check Button Chart
- Convert a Data Dump into a Visualization
- Funnel Chart Visualization
More Sophisticated Dashboards : for advanced users
- Republic Day Visualization
- 30 Day Challenge Dashboard
- Bubble Chart Matrix with Scrollbars
- Economist Chart Rework