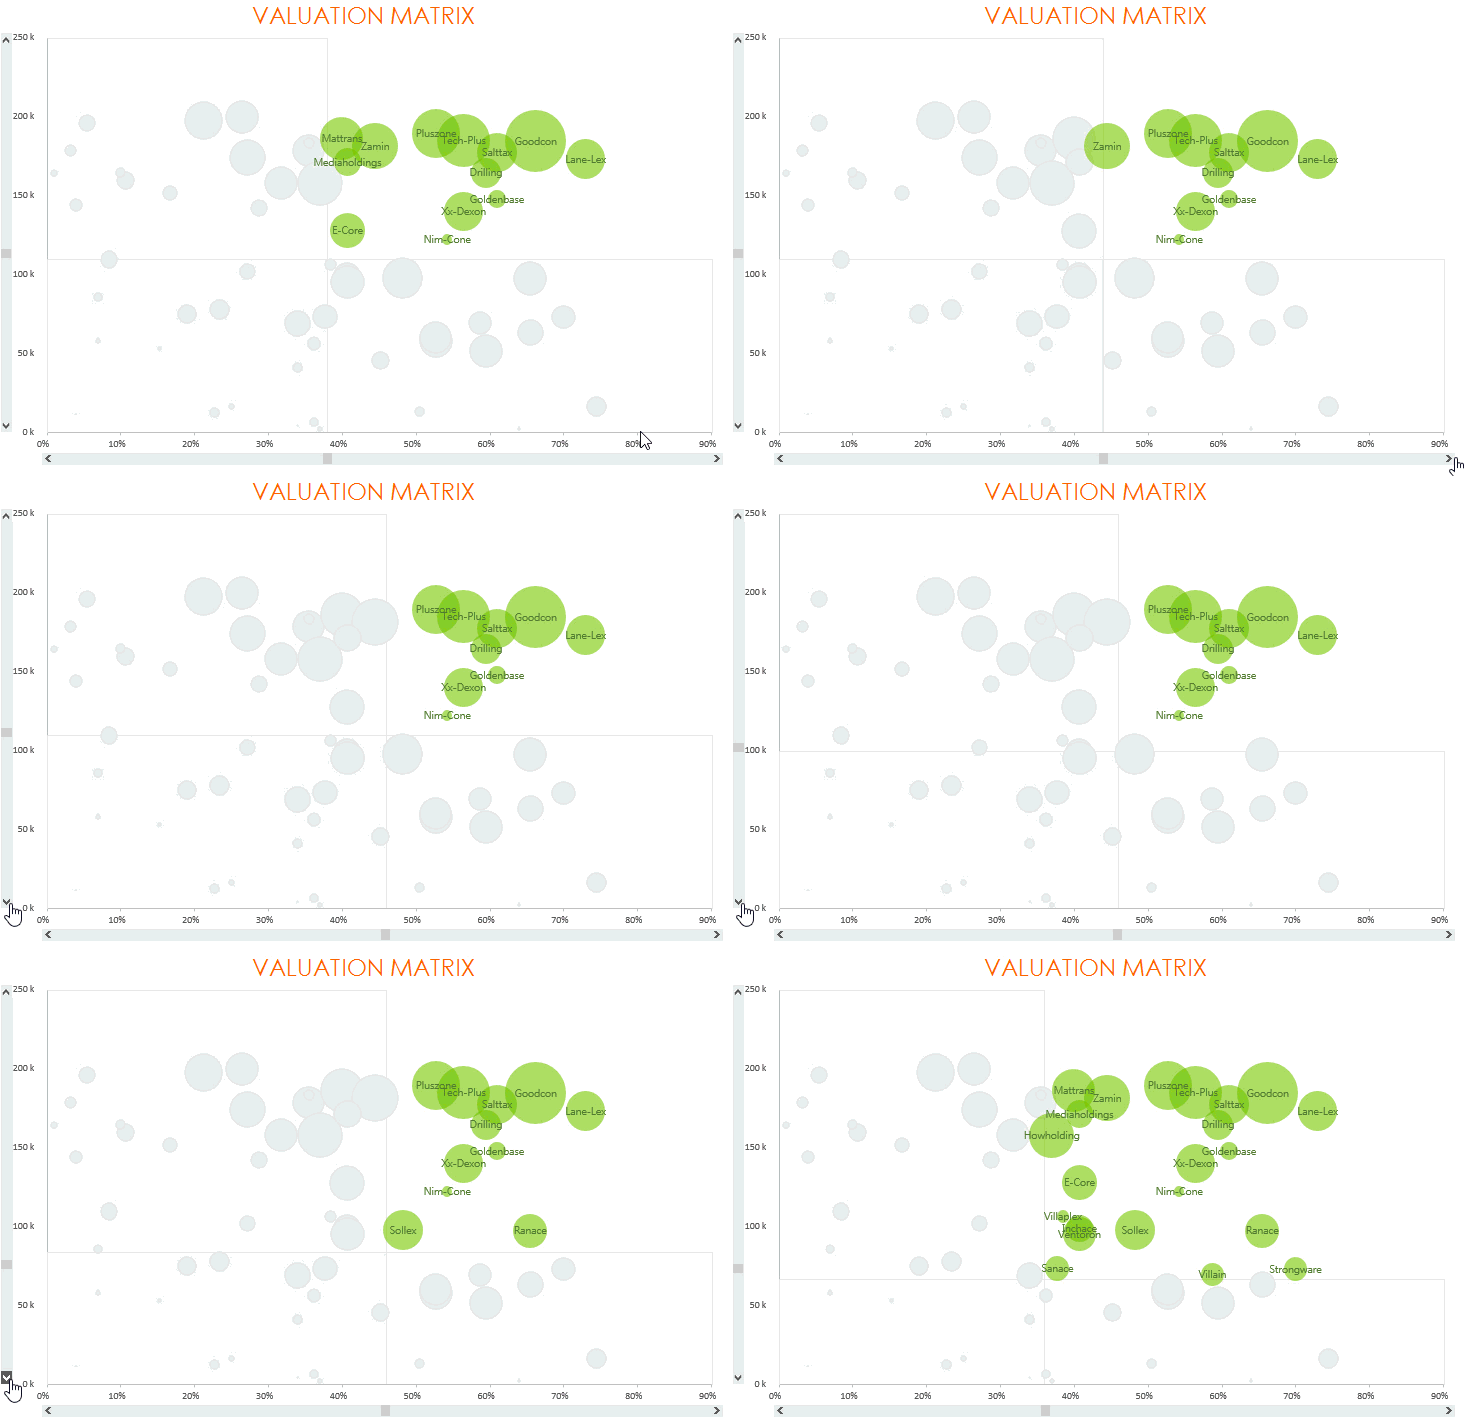
Here is an interesting way to convert your bubble chart into a dynamic matrix with 4 adjustable quadrants. Only the companies that meet the profitability (set by horizontal scroll) and sales target (set by vertical scroll) are highlighted
I have put together a simple 4 part video tutorial and downloadable files for you! Enjoy
Part 1 – Introduction to the Chart
Part 2 – Scroll Bars
Download the data set (discussed in the video) and also check out one more interesting tutorial on Scroll Bar
Part 3 – Bubble Chart
Part 4 – Adjustable Matrix
More Free Tutorials for You
- 5 Classic Animations for making stunning Presentations
- A Comprehensive Pivot Table tutorial and Sales Dashboard
How did you find this Chart ?
Please let me know what you think about this chart, put your views down in the comments section
