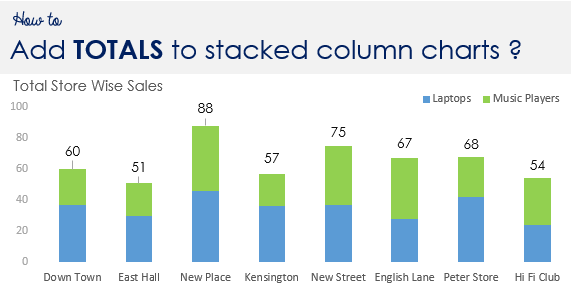
Here is a simple trick to add total labels to your stacked column charts..
Assume this data and a pre made stacked column chart
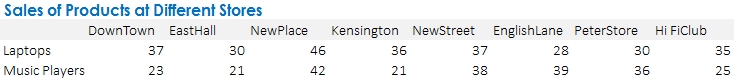
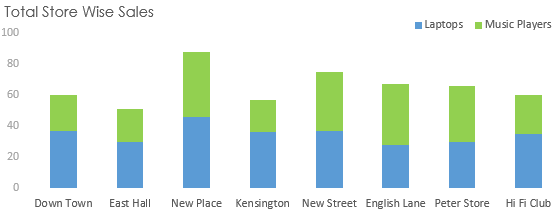
We now want to add total label (for showing Laptops + Music Player Sales) to this chart
Step 1 Add totals to your data
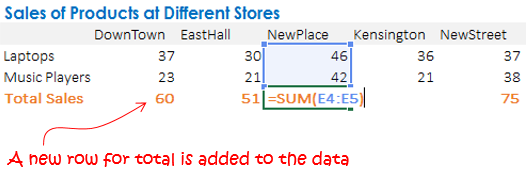
Add a new row that calculates the sum of the products
Step 2 Add totals to the Chart
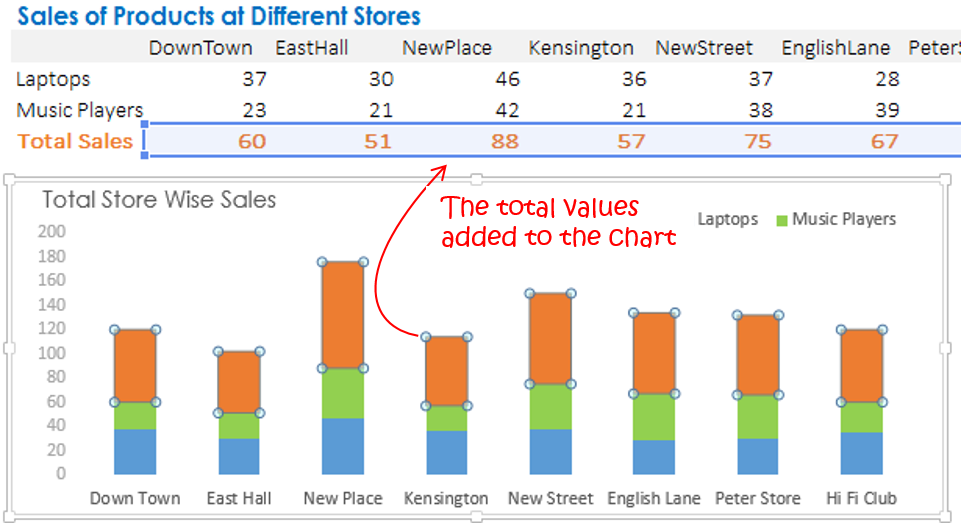
To add the totals to the chart
- Copy (Ctrl + C) the Total Sales (Values only)
- Then select the chart and Paste the values (Ctrl + V)
- The chart will incorporate a Total bar on top of Laptops and Music Sales, but that is not what we want!
So let’s fix it!
Step 3 Move the total bars to secondary axis
Move the Total Bar (only) to the Secondary Axis and do a No Fill to the Total Bar
Step 4 Now Add Data Labels
Just Add the Data Labels. One of the things which can be tedious is to place the labels on top of the bars. There are two ways to solve this
- Drag each label manually to the top of each bar (as shown above)
- Or change the chart type of secondary axis (total bar) to clustered column chart and place the data labels on the top (I would go with this one)
- Also don’t forge to hide the secondary axis, since it has no meaning!
More on Charts
- How to pick the right color for your charts
- How to make a Waterfall Chart
- Quick Tip : How to draw a Chart in 1 Keystroke
- How to make a check button Chart