A while ago I created a Learning and Development Dashboard Template and to my surprise it got a LOT of downloads, people even wrote to me for consulting assignments to customize the it (not one not two, many!).
To your surprise that Dashboard was crap! Especially when I look my old work today. So I created a new one, a whole lot better.
- Better in terms of Visuals and Design
- Better in terms of features, functionality and analytics
- And a Heck of a lot simpler to implement it with your own Company’s data
Let’s dive right in!
Learning and Development Dashboard Tour
Learning and Development Dashboard Tour
The L&D Dashboard comprises of 6 Analysis Screens.
-
- Overview Analytics – Gives you broad insights about important training metrics and the ability to slice and dice (filter) the dashboard by key dimensions.
- Training Planner Analytics – Shows you various training programs planned in a Calendar View. Along with broad metrics like absenteeism, most trained departments, etc.
- Feedback Analytics – You’ll get insights about Training Feedback Score alongside Training Cost and Employees Trained.
- Cost Analytics (Pro) – Deep dive into annual trends for training cost, per employee cost, most expensive training programs sliced by different dimensions.
- Cost Leak Analytics (Pro) – Gives you insights about training Cost Leak from Attrition (people trained and attrited / left) and Cost Leak from Absenteeism (No Shows on the day of Training). These metrics can be customized and sliced by different dimensions.
- Miscellaneous Analytics (Pro) – Insights on managing training programs for new hires and assessing gap between re-organizing training programs.
Let’s take a look at each one of them in a little bit more detail.
Screen 1 – L&D OVERVIEW ANALYSIS
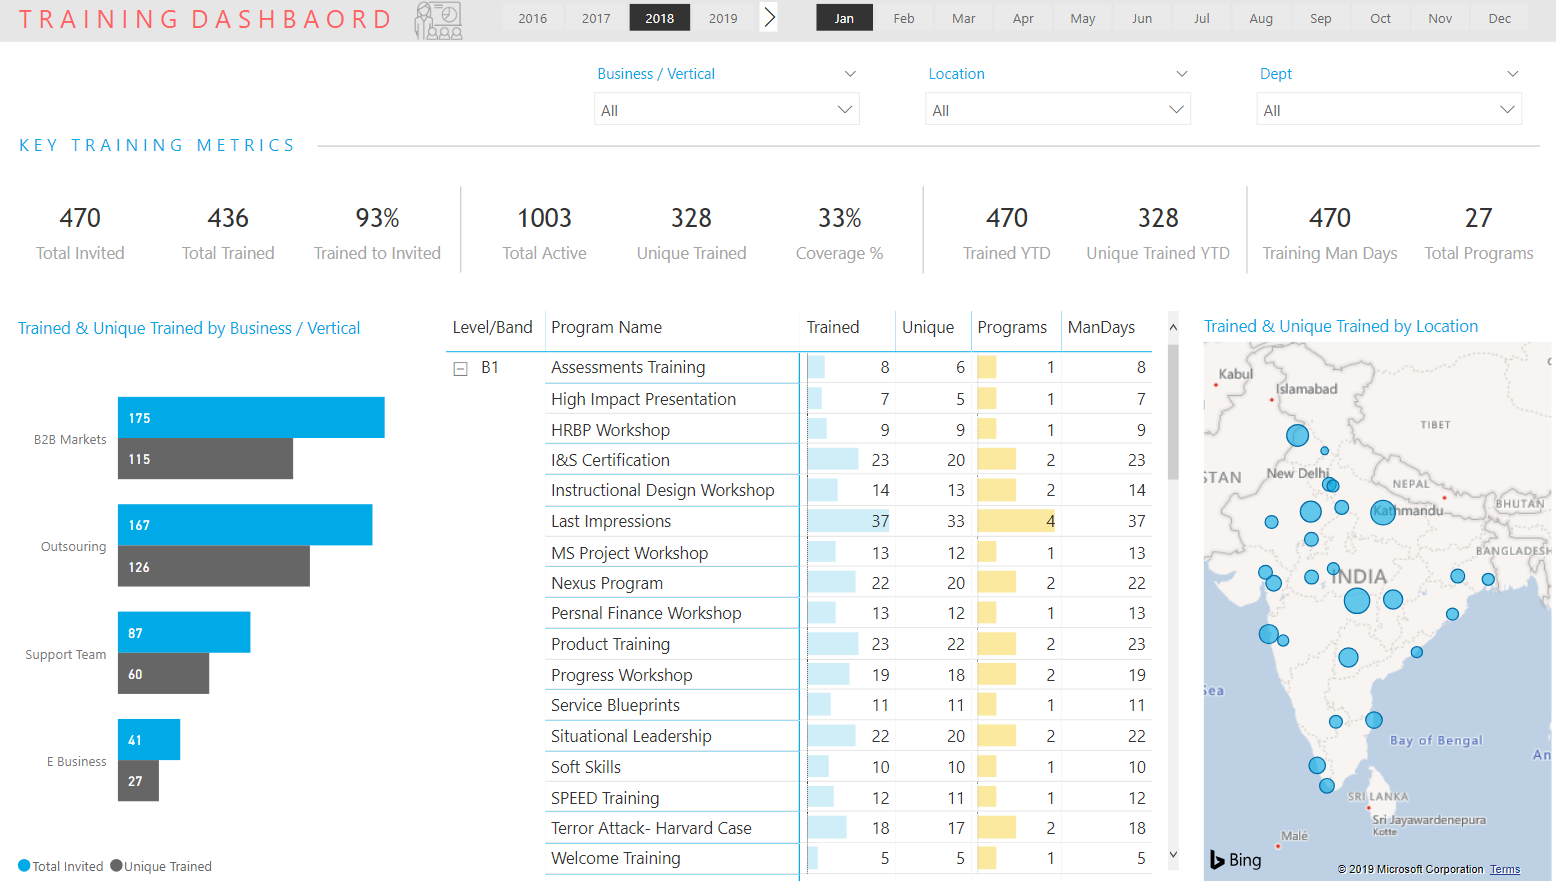
Objective is to give you a 30,000 feet overview of the L&D activity with the broad metrics displayed + the ability to filter and deep dive into key elements of the Dashboard.
- Key Metrics Displayed – Total Invited, Total Trained, Unique Trained, YTD Numbers, Total Active Employees, Training Man-Days, Total Programs
- Some Key Features
- Map Visual – Employees trained in different locations.
- Filters and Cross Filters – Clicking on the chart elements enables filters across the entire Dashboard
- Add / Remove Filters.
- Add / Remove Visuals.
Screen 2 – L&D PLANNING ANALYSIS
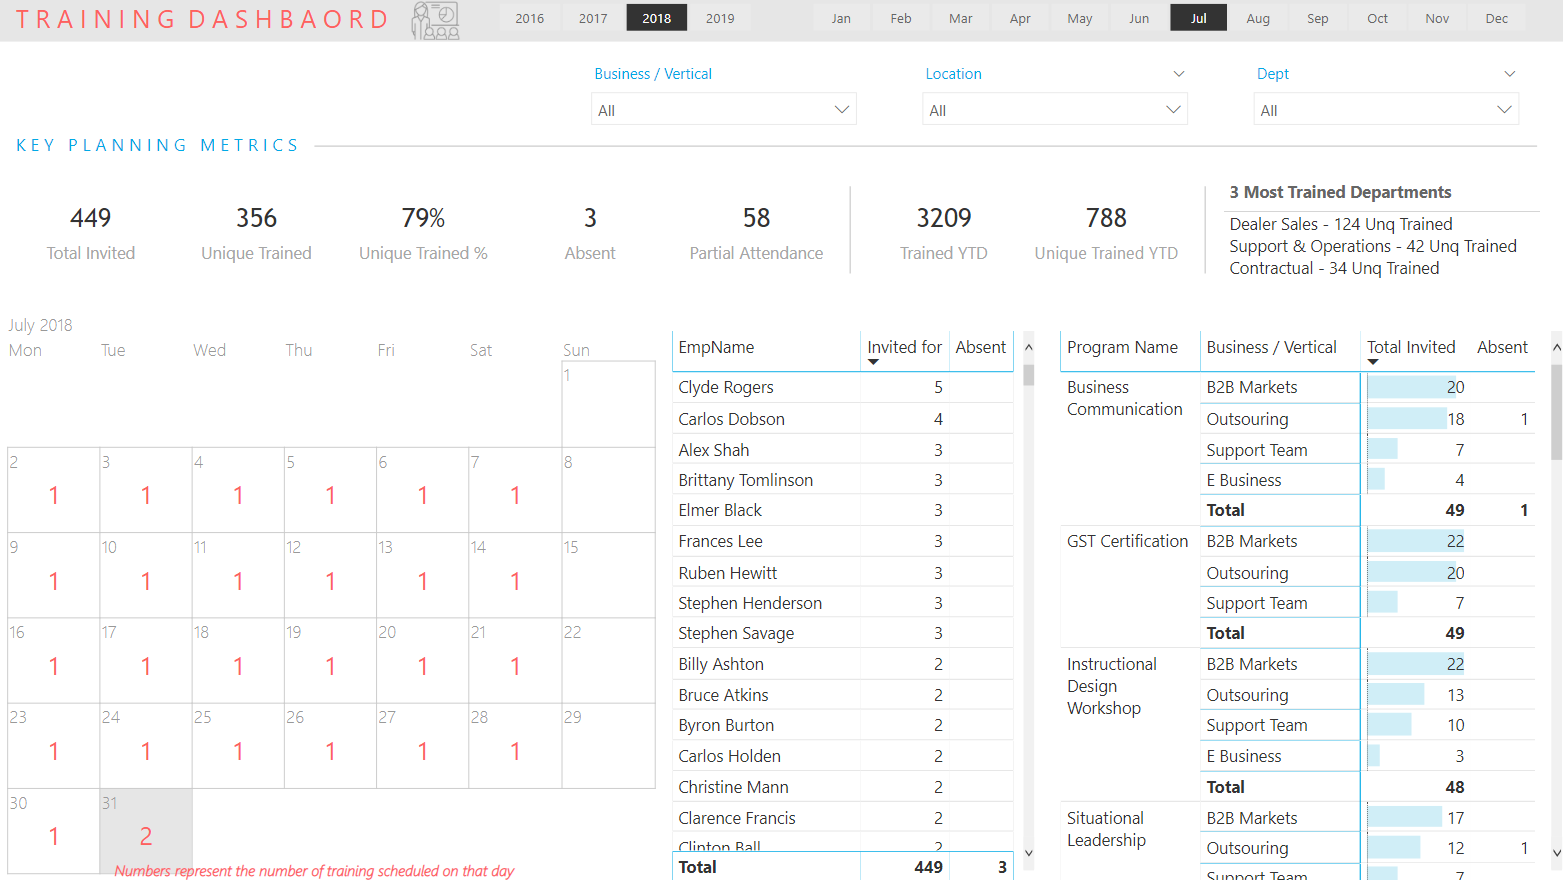
Objective is to give you the ability to plan and track the training programs at a more granular level on a Calendar Visual.
- Key Metrics Displayed – Some Metrics carried from Overview Analysis + Absent Employees, Partial Attendance Employees, Invites Sent, Most Trained Departments.
- Key Features
- Calendar Visual – Track training programs on a Calendar
- People Invited and Absent – In a Table
- Dynamic Visual of 3 Most Trained Department by Unique Employees
- Add / Remove Filters
- Add / Remove Visuals
Screen 3 – L&D FEEDBACK ANALYSIS
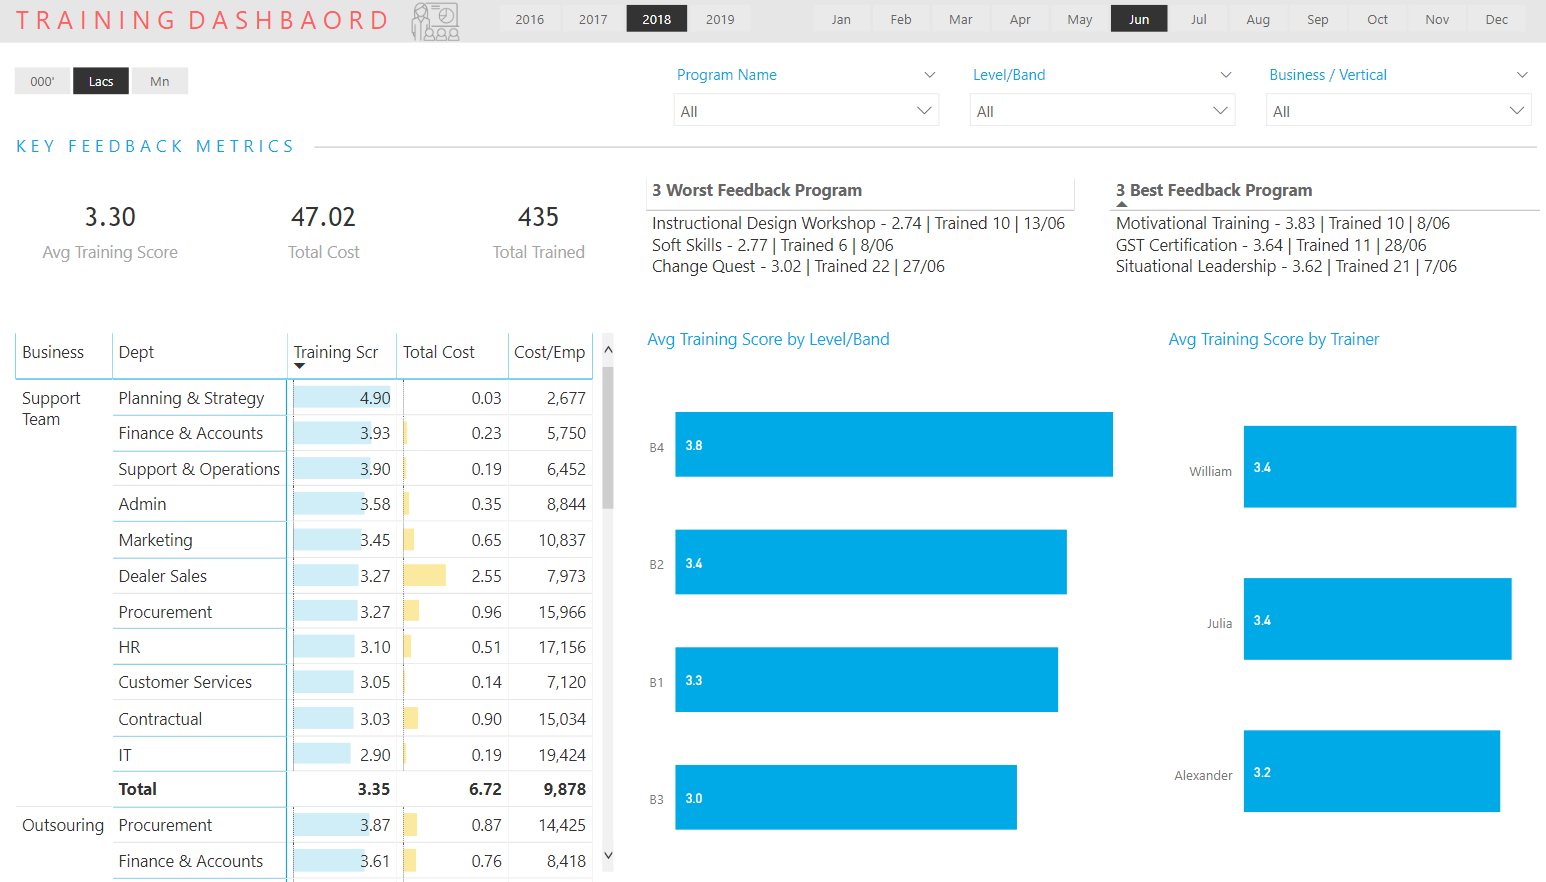
Objective is to give you important insights about Training Feedback and alongside compare it to Training Cost and Employees Trained.
- Key Metrics Displayed – Avg Training Score, Total Cost, Total Trained, 3 Best Feedback Programs, 3 Worst Feedback Programs.
- Key Features
- See the training feedback score and cost of the training side by side
- Compare the feedback by trainer
- Compare the feedback by training program
Screen 4 – L&D COST ANALYSIS (Pro Version)
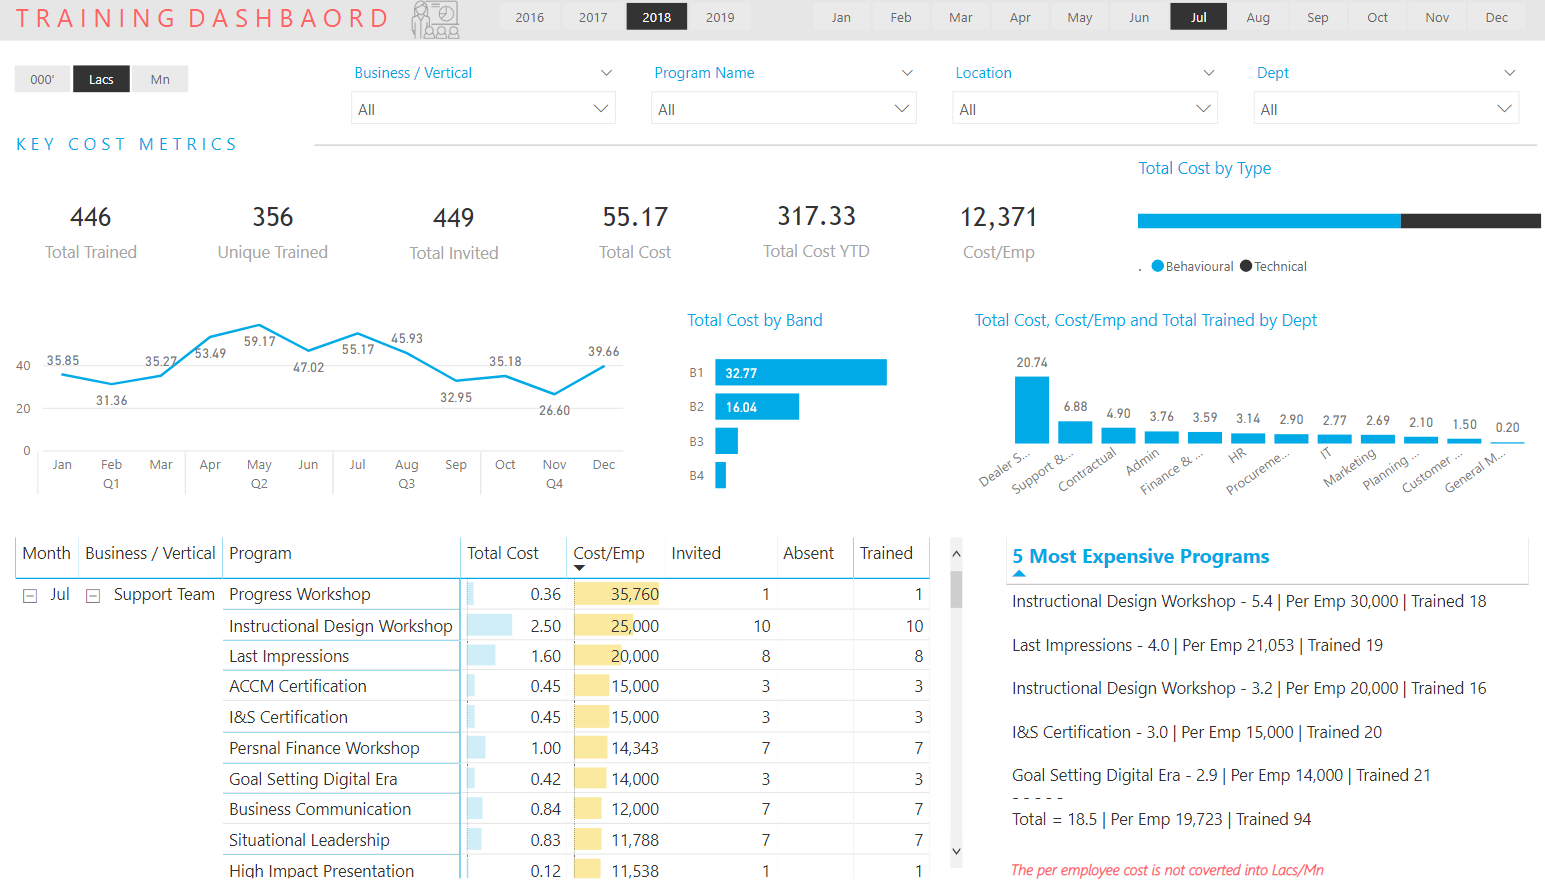
Objective is to provide in depth analysis of the training cost and annual trends, along with the ability to slice and dive deeper to a granular level.
- Key Metrics Displayed – Total & Unique Trained, Total Invited, Training Cost, Cost YTD, Cost per Employee, 5 Most Expensive Programs.
- Key Features
- Monthly Training Cost Trend – for the entire year
- Compare Cost Trend and Absenteeism
- Dynamic Calculation for 5 Most Expensive Programs
- Slice and Dice by Department, Band & Program Type
- Add / Remove Filters
- Add / Remove Visuals
5 – L&D COST LEAK ANALYSIS (Pro Version)
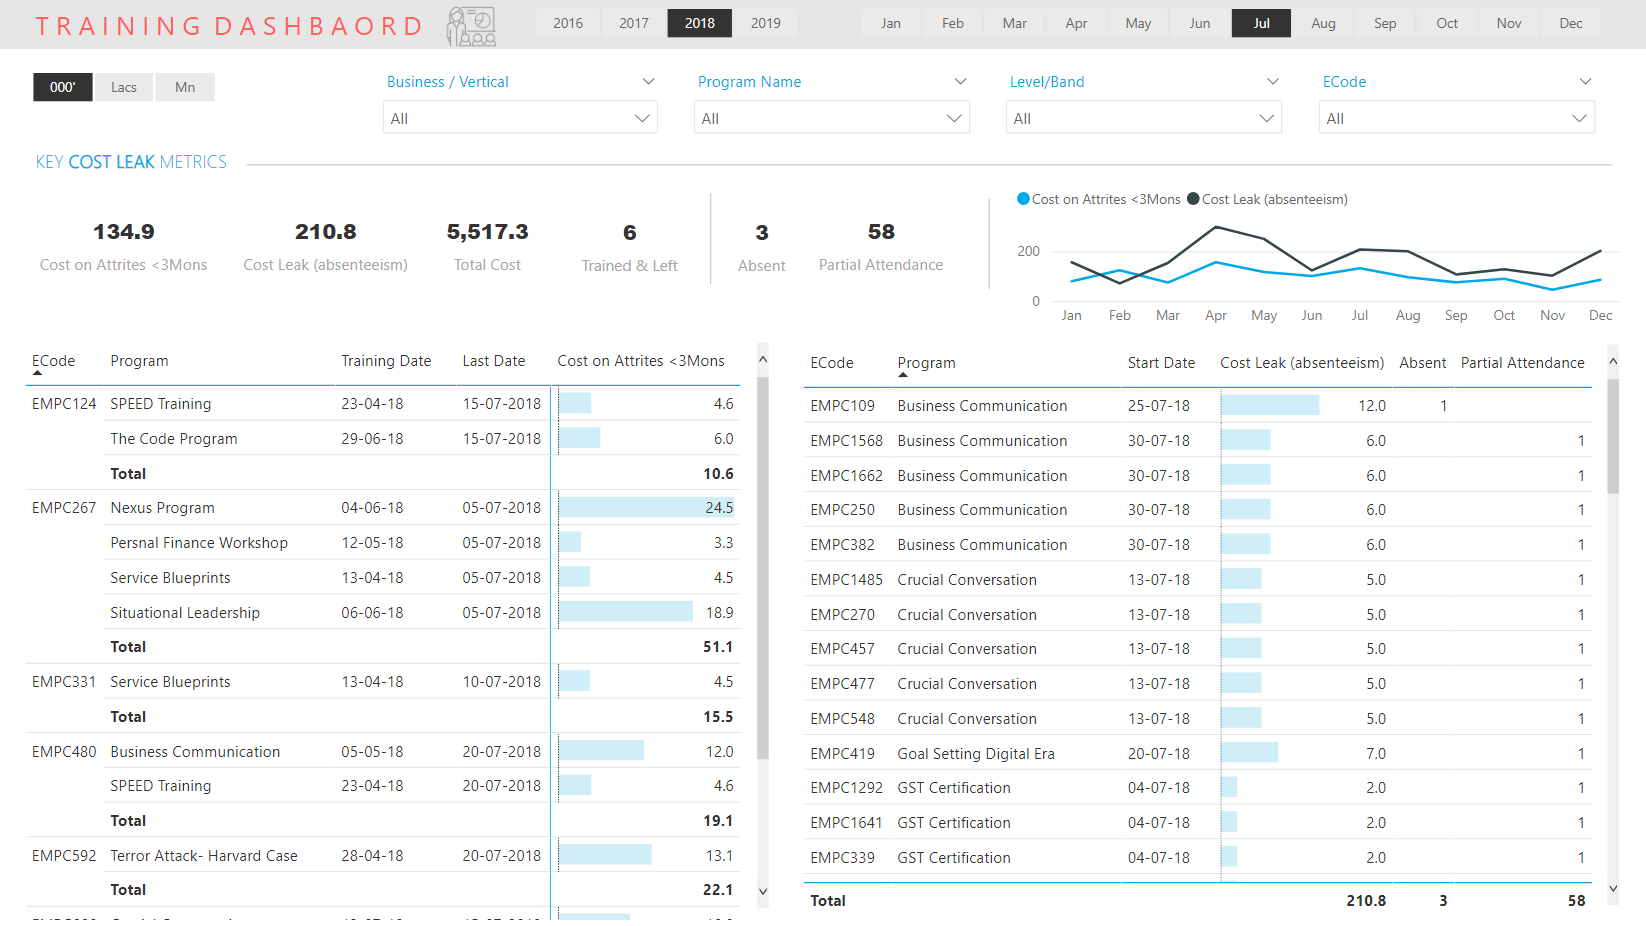
Objective is to provide in depth analysis of training cost leak & cost leak trends, along with the ability to slice and dive deeper to a granular level.
- Key Metrics Displayed – Training Cost Leak due to Attrition, Employees Trained and Left, Training Cost Leak due to Absenteeism, Absent and Partially Absent.
- Key Features
- Monthly Cost Leak & Trend – for the entire year
- Drill down to Employee and Training Level for both – Attrition Cost Leak and Absenteeism Cost Leak
- Add / Remove Filters
- Add / Remove Visuals
6 – L&D MISCELLANEOUS ANALYSIS (Pro Version)
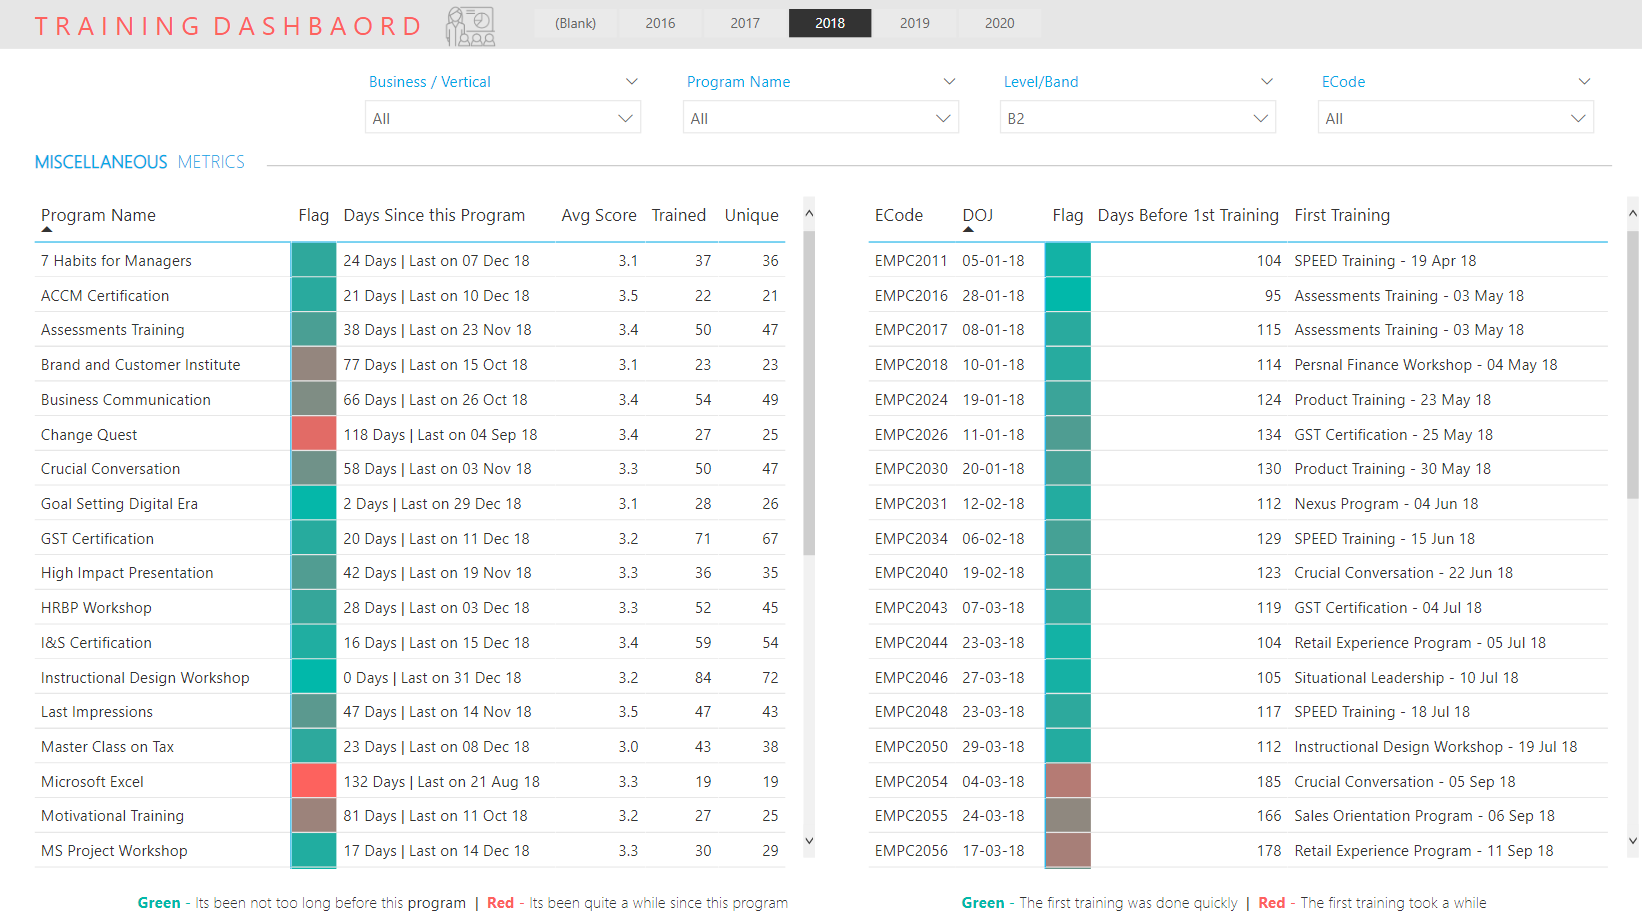
Objective is to provide 2 key analysis about training programs that are overdue and insights about the first training that employees receive after they join.
- Key Metrics Displayed – Days Passed Since the Program was Last Done, Highlighting Flag, Avg Training Rating, Total Trained and Unique Trained, No of Days Before the Employee Receives his First Training, First Training Name and Date.
- Key Features
- Dynamic Table Highlighting Format – Days since the program
- Dynamic Table Highlighting Format – Days Before 1st Training Happened, Training Name and Date
- Add / Remove Filters
- Add / Remove Visuals
Data behind the Dashboard
All of what you have seen won’t have been possible if there wouldn’t have been the rows and columns filled with data. Let me first show you the architecture of the Dashboard (how the data flows in the Dashboard) and then let’s take a tour of the excel files used as Back-end Data
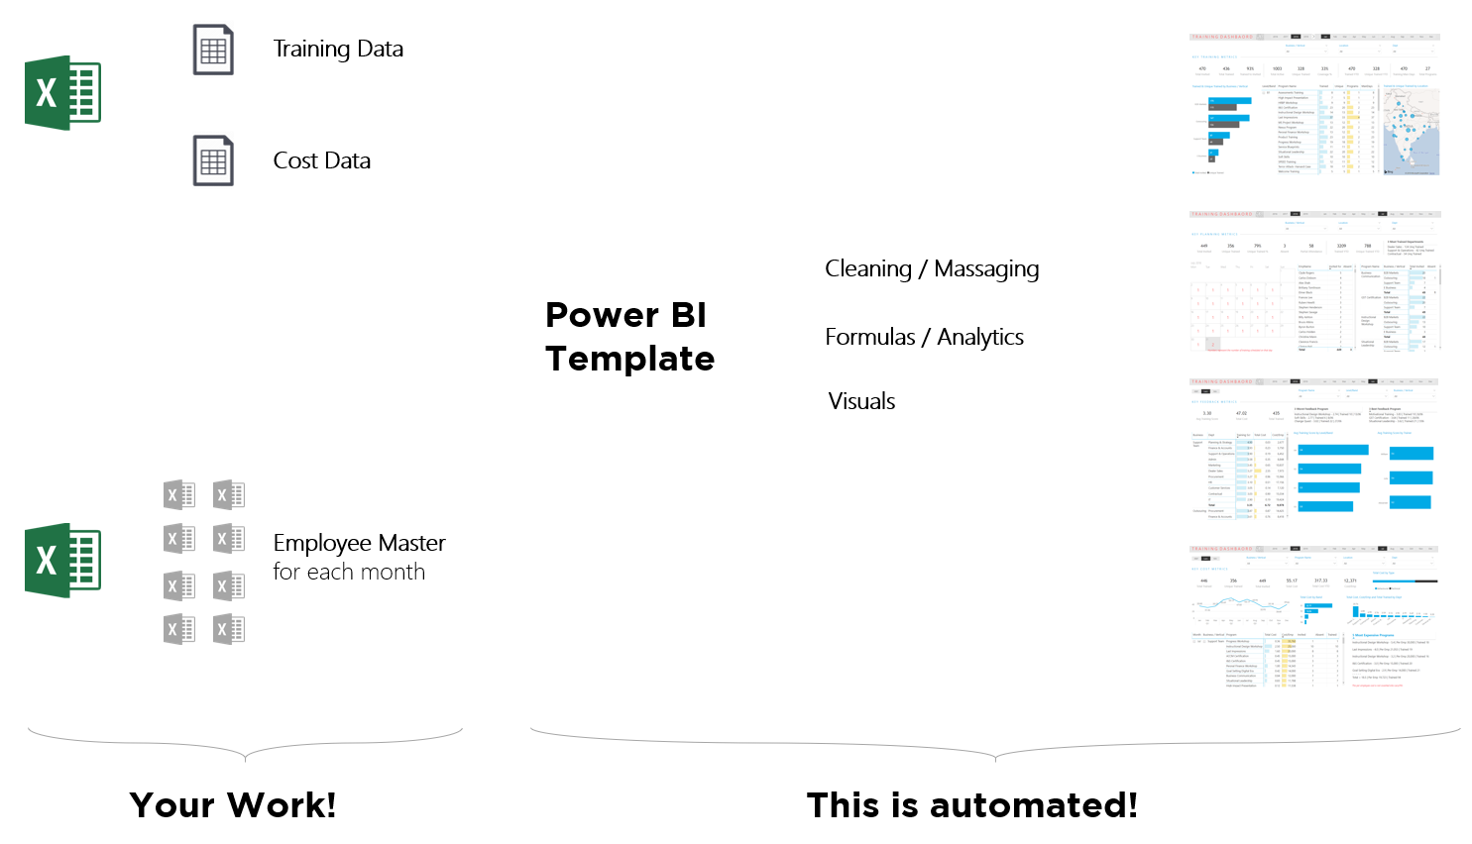
The data flows from a few excel files that you maintain into the Power BI file (template) and updates all the data massaging, calculations / analysis and visuals. The only thing – you strictly have to maintain the data in the desired format, rest is automated! 😎
The Data Files – The data flows from 2 sources:
- Employee Masters and
- Training + Cost Data
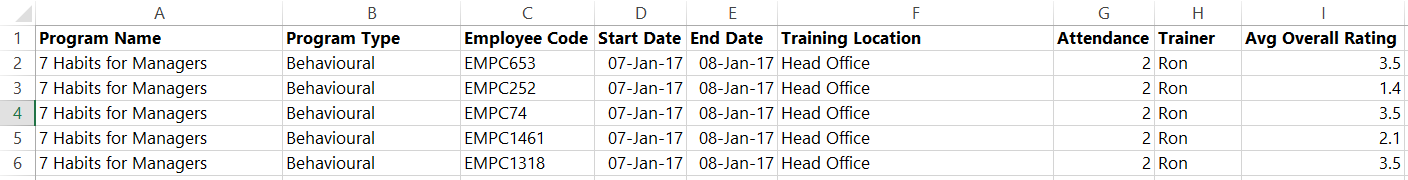
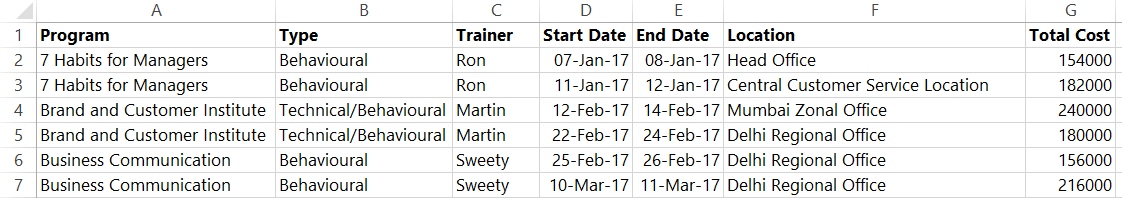
Data Source #1 – An Excel File With Training and Cost Sheet – Here are the list of columns which are there in training and cost sheet in this excel file
Training Details Sheet
Cost Details Sheet
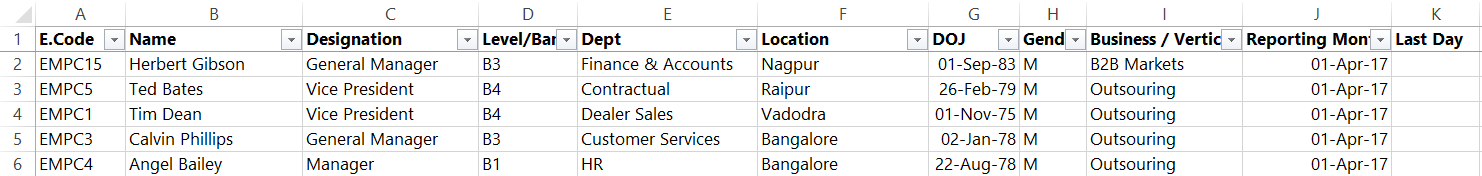
Data Source #2 – One Employee Master for each month – A new employee master is added each month because some employees could have moved departments, cities or other key details of their employee record base. To ensure the sanctity of the employee details at the time he / she underwent a training, an employee master for each month is of utmost importance.
In the picture below you’ll see the columns in a single employee master (which remains same across all employee masters for each month)
I’ll say it once again – Since this is a template and for the Dashboard to function properly with your data, it’s very important to maintain the data in the desired format!
Implementing L&D Dashboard for your Own Company
Once you have the data ready, this is pretty much a plug and play template that you start using instantly for your own company’s analysis. Now that you have seen the Dashboard, you can ask yourself 2 quick questions.
- Did you like the Analysis + Visuals presented in the Dashboard?
- Can you collect and maintain the data in the desired format?
If the answer to the above question is YES, go for it you won’t regret a dime you spend on this template!
Requirements
- You need to have the latest Power BI Desktop. It’s free – you can download it here
- And of course Excel 2007 or above version to maintain the back end data (excel files)
- You’ll need a windows computer to setup this Dashboard. Power BI doesn’t work on a Mac 🙁
Purchase the L&D Dashboard Template
Purchase the L&D Dashboard Template
Once you purchase the template you’ll be
- Directed to a secure login.
- Where you can download the template and back-end files.
- You’ll also have the lifetime access to detailed video guides on configuring & customizing the dashboard
Have Questions?
I am sure you have! Probably many. I have compiled a list of FAQs. The comments are open and I don’t want your questions to go un-answered.
Cheers