Anyone trying to create a Profit and Loss styled Excel Pivot table would wonder how can you show values in rows in a Pivot Table.
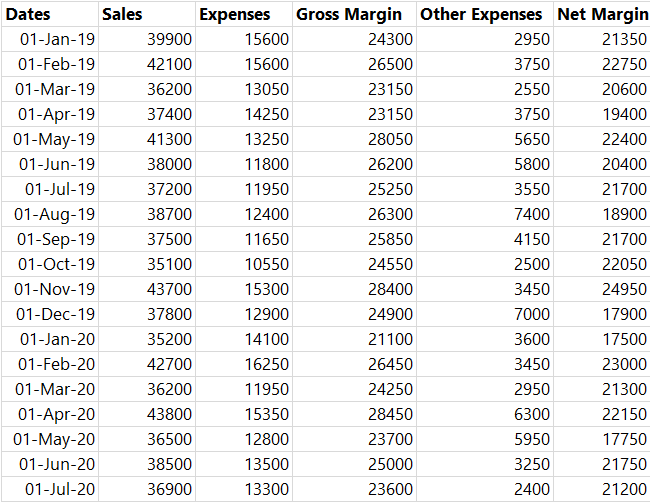
Imagine this simple data
To display the values in the rows of the pivot table, follow the steps
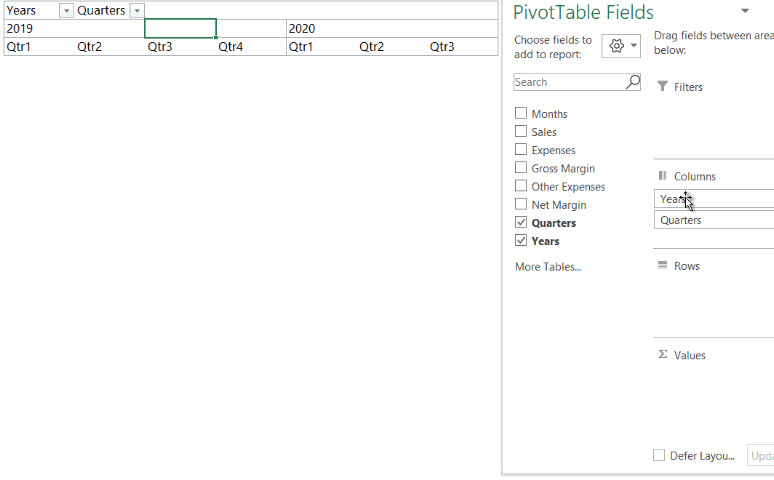
- Now when you start creating a pivot table
- Drag Dates into Columns
- Add the first field – Sales into Values
- Then add the second field – Expenses into Values
- You’ll see that “Σ” Values field in columns area
- Just drag that in rows and you are done!
Show Values on Rows in Power BI
The same can be achieved in Power BI too
- Create a Matrix Visual (i.e. a Pivot Table)
- Drag Years / Months in Columns
- Then Drag two or more fields / measures in values
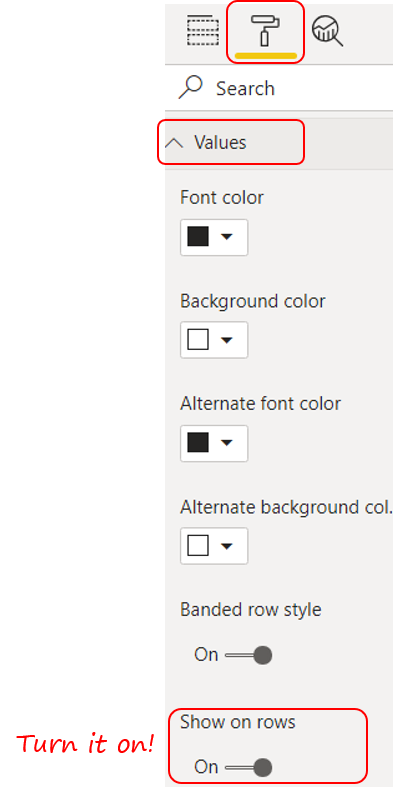
- Go to the formatting tab of the Matrix
- Under Values you’ll find the option to show the values on rows – turn it on
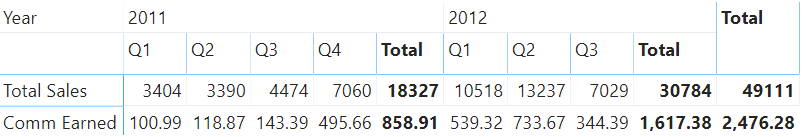
You’ll end up having a pivot like this
Nifty.. huh!
Want more Excel / Power BI Tricks?
- How to Create a Pivot Table in Power BI
- COUNTIF in Power BI using DAX
- Filter Data using Multiple Conditions using Power Query
- Nice and Fast – Filter Shortcuts in Excel
- Create Hyperlinked Index of Sheet Names in Excel
.

Want a Step by Step way to Learn Excel ?
Master Excel Step by Step is an easy to follow, step by step online course to help you build rock-solid skills in MS Excel.