On 1st March 2016, I challenged my self to run 150 kms. 5 km each day for 30 days back to back and I am extremely stoked to tell you that I have successfully completed that challenge. Woohoo!
I want to share with you everything about the #30daychallenge (the highs, the lows, the mishaps, the resources) and a beautiful Dashboard I made from all the data that I collected during these 30 days
Introduction to 30 Day Challenge
During one of my random running sessions, I was thinking of doing something different on my birthday (27 Apr), since I was running while I was thinking so I though, why not run? like 10 kms a day for 30 days.
Soon after that I consulted a friend (physiotherapist), since I just recovered from a knee injury he said : “your knee is not ready yet to take that stress, so take it easy”. I did pay heed to his advice and choose a 5km / day target instead and just to make it reasonably challenging I added a mild workout session everyday along with the running
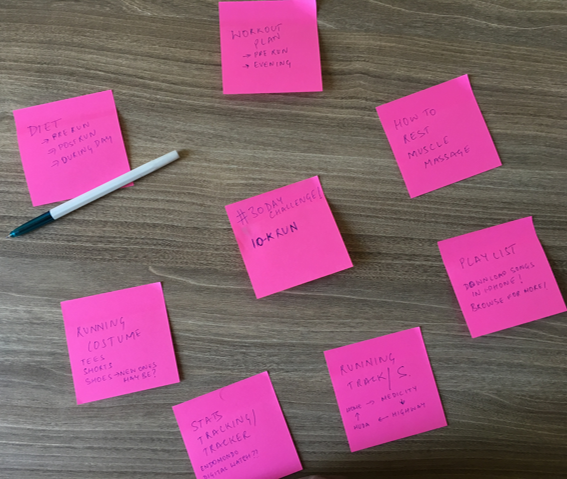
Pic: When I started planning for the #30daychallenge. Finally Settled with 5km a day
Highs and Lows during these 30 Days
I must say that 30 days of back to back running in the initial week looked pretty difficult. But from the 2nd week on wards it became relatively easy to keep up to the task.
Also during this time, I ran a double whammy marathon (10 + 10) kms for 2 days on 19th & 20th March, It was impromptu and fun

A pic from Double Whammy Marathon – 19th & 20th March
There was indeed one bad thing that happened during these 30 days. During one of my runs, while I was on holiday in Koh Samui, Thailand I was chased by a street dog and bruised my palm and right knee badly.
Grrr.. I hate that moment for an additional reason because I broke my IPhone’s screen when I fell on the road! Phew!! I don’t want to recall that anymore, it still hurts at both places (knee and pocket). By the way that Thai dog did not bite me 😀
Because of the injury I could not do any workouts during the last week but managed to keep up with the running everyday!
And now the 30 Day Challenge Dashboard
I collected my routine, workout, running and diet data for 30 days. I mean what better can you do with the data than creating a beautiful dashboard. Let’s take a tour of the dashboard
INTRODUCTION SCREEN
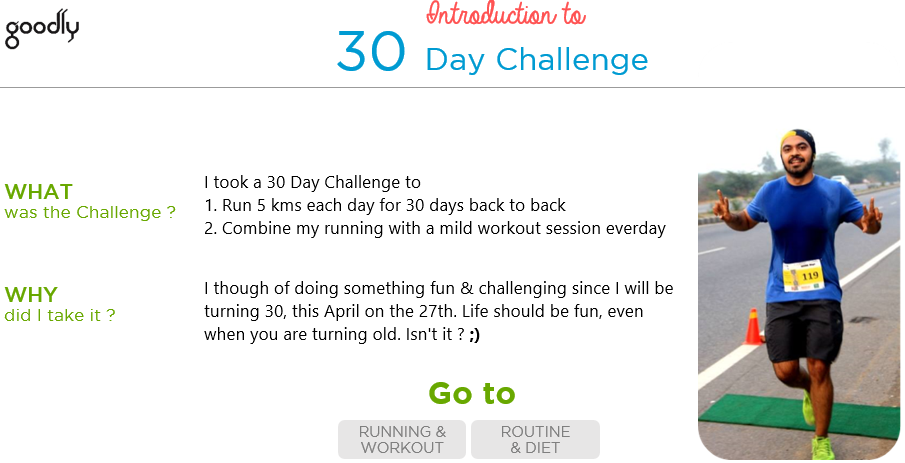
- A simple enough introduction
- Two clickable buttons that take will take you to the respective page
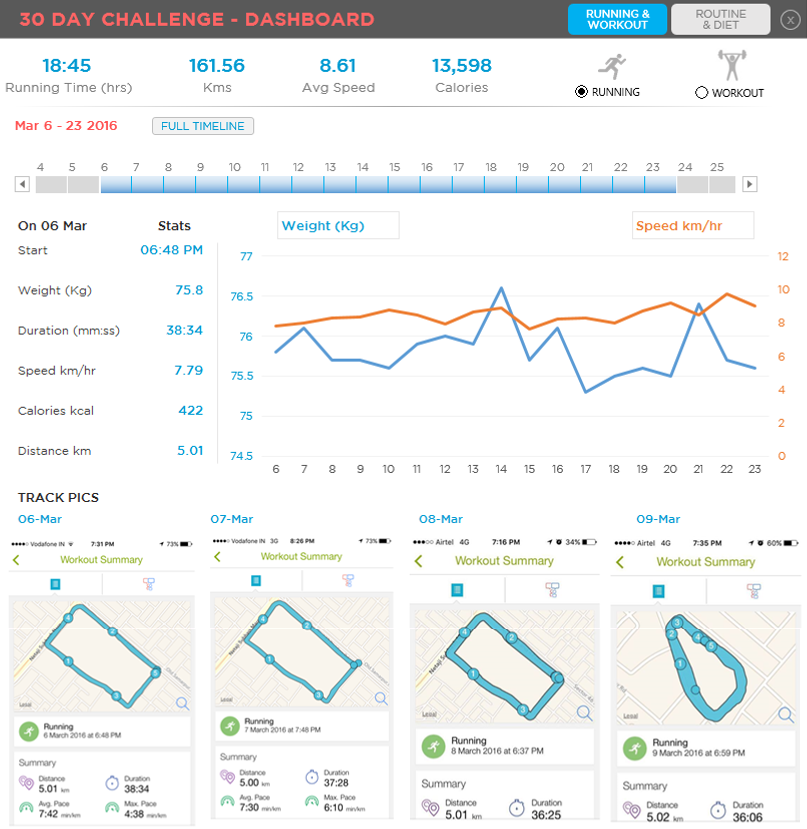
RUNNING & WORKOUT SCREEN
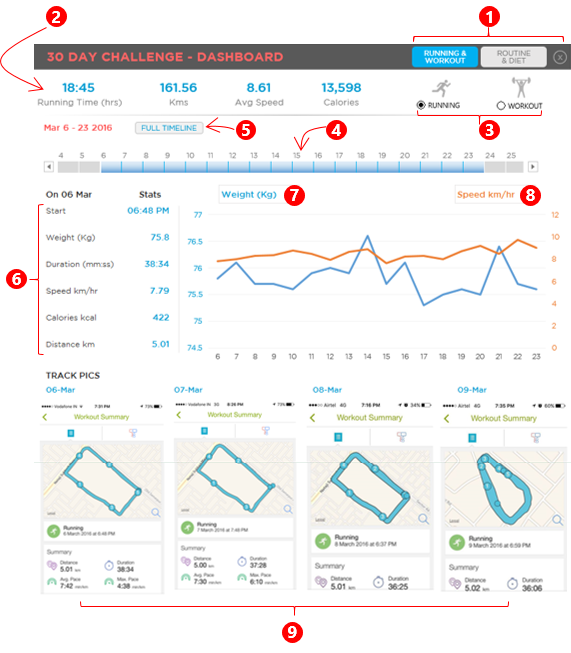
There are 9 things that I want to talk about here
- Running and Working Tabs will take you to the respective visualization, the close button will redirect you to the intro screen
- Major Statistics for 30 days are displayed on the top and will change depending on running or working being selected
- Running or Workout Selection – Since I have 2 things to display I have offered option button to choose between running or workout visualization
- Timeline to choose the periods – The timeline will allow you to select customized periods for the line graph
- Full Timeline – You can click on the button to select all 30 days of march automatically
- Daily Stats are shown of the first date in the selected time period (in the timeline)
- Drop Down 1 – You can pick up any variable and see my performance in the selected time period
- Drop Down 2 – You can pick up any variable and see my performance in the selected time period
- Track Pics change automatically. From the 1st date in the selected time period, it shows 4 successive track photos. For example if you have chosen 4th- 20th march in the timeline, it will show track pics of 4, 5, 6, 7 March
ROUTINE & DIET SCREEN
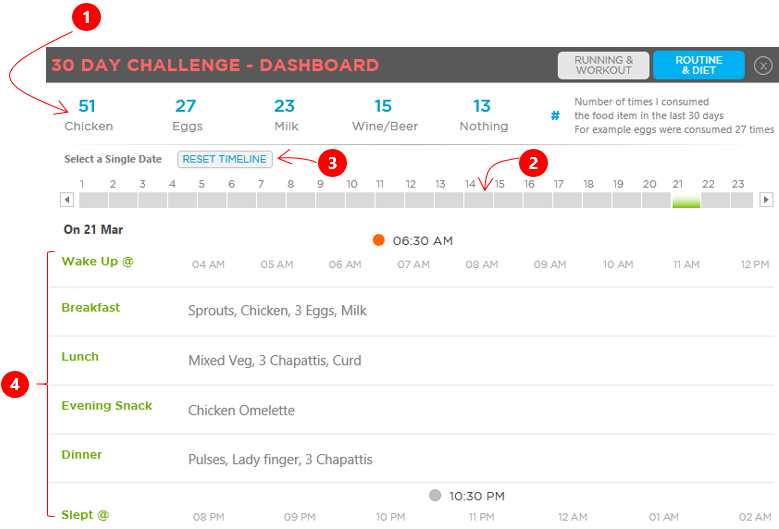
Here are the 4 things that you should take a note of
- The Major Stats talk about how many times have I consumed the food item in the last 30 Days. So 27 Eggs does not mean I have consumed 27 eggs in total, it means I have had eggs, 27 times in the last 30 days 😀
- The Timeline allows you to select a single date. Even if you select multiple dates it will show data for the first date in the selected time period
- The Reset Button will reset the selected date to 1st March
- The Data is displayed of the date chosen in the timeline
DOWNLOAD THE DASHBOARD FROM DOWN BELOW
- Dashboard works best in Excel 2013, since I have used timeline feature
- Please enable macros before having fun with the Dashboard
How long did I take to build the Dashboard
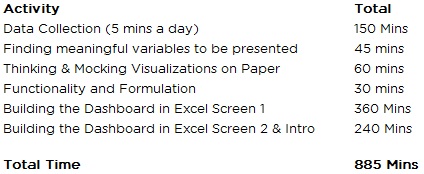
I invested time in bits an pieces to build the dashboard. In all it took approximately 15 hours to create it!
I would love to hear what you think?
Go ahead download the Dashboard, it is unlocked an free! Let me know if you like (or even hate) anything particular in the dashboard.
If you and I are Facebook friends, thank you so much for bearing all the spamming that I did for 30 Days to follow through the challenge 😉
DOWNLOAD THE DASHBOARD FROM DOWN BELOW
- Dashboard works best in Excel 2013, since I have used timeline feature
- Please enable macros before having fun with the Dashboard
If you want to learn how to build this Dashboard..
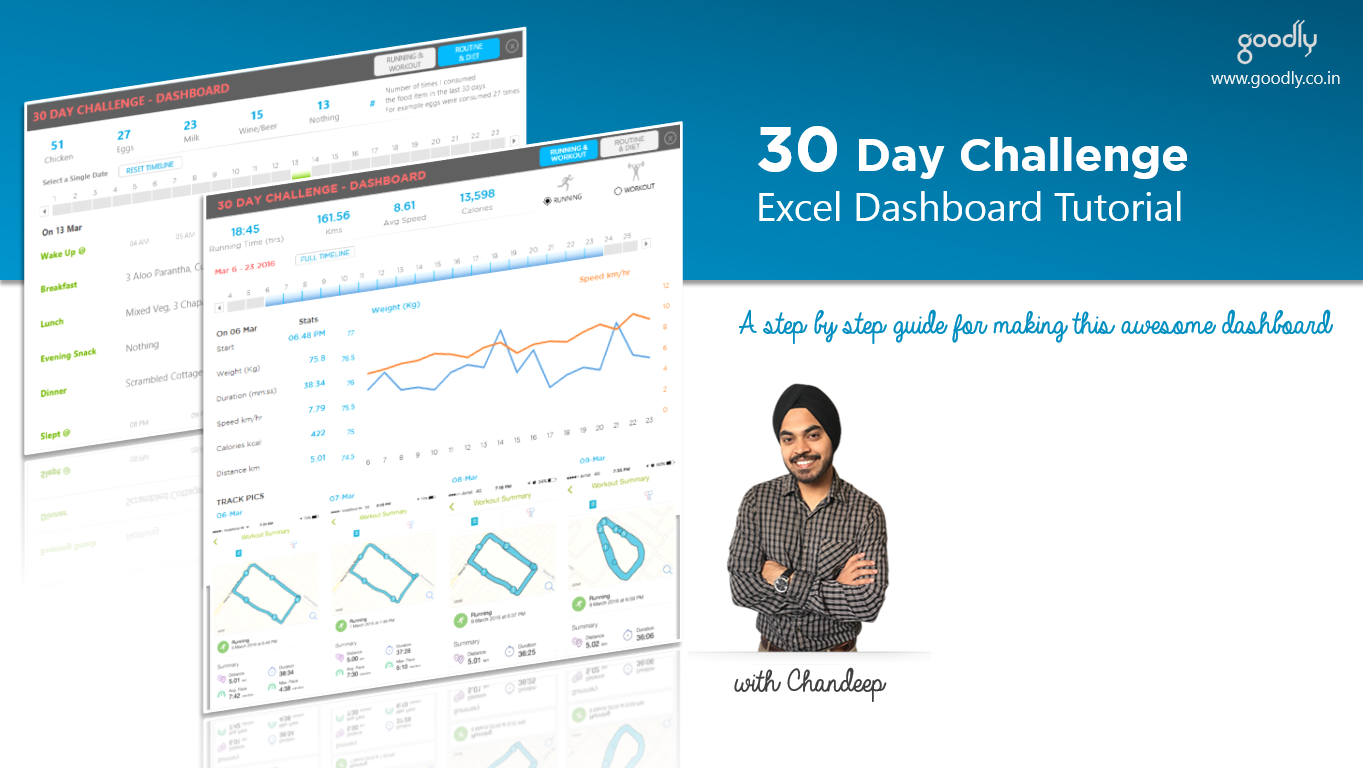
The queries on how did I create this Dashboard, went over the roof so I sat tight and made a video course around it
- The course is a comprehensive set of 8 modules taking you through a step by step process that I followed to make this Dashboard. Starting from a blank spreadsheet to the ticked and tied Dashboard
- Plus along the Dashboard tutorials I share some of the best Dashboard making practices both in terms of design and Functionality
YOU CAN CHECK IT OUT HERE
More Awesome Dashboards for you
- Indian Republic Day Dashboard
- Stock Ticker Visualization
- World’s Biggest Economies Visualization
- Human Resource Dashboard in Excel