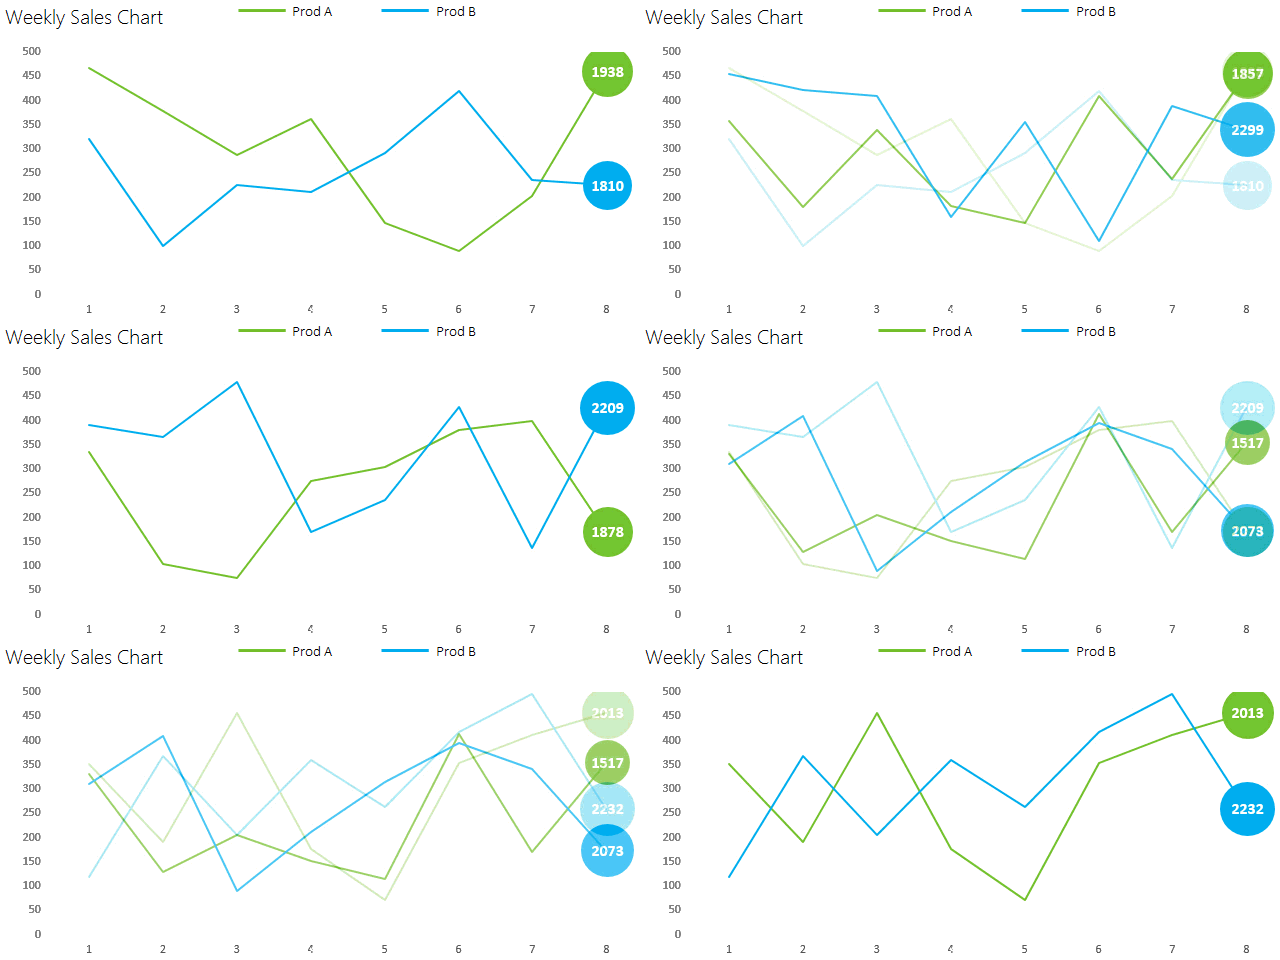
Line charts are used to depict trends across time. It is quite useful (and equally cool) to add a total bubble at the end of the line chart. Let’s see how that can be done
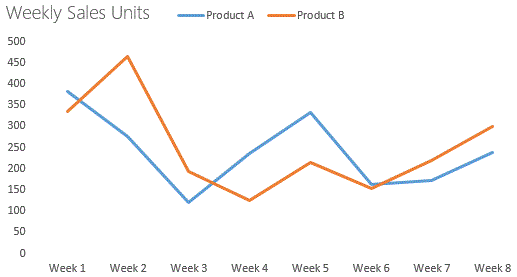
Consider this data and line chart


We have eight week of sales data and its total and a simple line chart .. so far so good?? Just in case you want to learn more about basic charting in excel (Charts Part 1, Part 2, Part 3)
The Total Bubble Trick
I could not find a way to integrate a bubble chart with a line chart, but we can trump the conventional charting method to make it happen somehow.. lets get our head around this, it is pretty simple!!
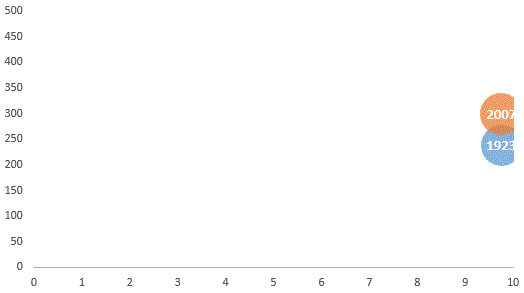
We’ll create a bubble chart separately and place it on top of our line chart to make it look like a single chart. But we need some dummy data to get this done..
Here is the dummy data

I’d explain this
X : This is the co-ordinate of the X Axis and the reason why I have started the numbering from 1.75 is because it is going to push the total bubble a bit towards the right
Y: The co-ordinate of the Y Axis is starting from -100 hundred because I want only the total bubble, so by choosing -100 I am pushing down the rest of the bubbles under 0 (to make them not visible). Note only the last Y co-ordinate is actual value which is in-line with week 8 data
Size: The reason for 10000 (or any relatively larger number) as compared to our actual bubble size (i.e. total of 8 weeks) is that it will restrict the bubble not go beyond a certain size on the chart
Bubble Chart and Modifications

Please note a few chart formatting editions to make this tip top
- You’ll have to change the chart axis. Y axis should be from 0 – 500 and X axis should be from 0 – 10
- The bubble chart size should exactly match the size of the line chart
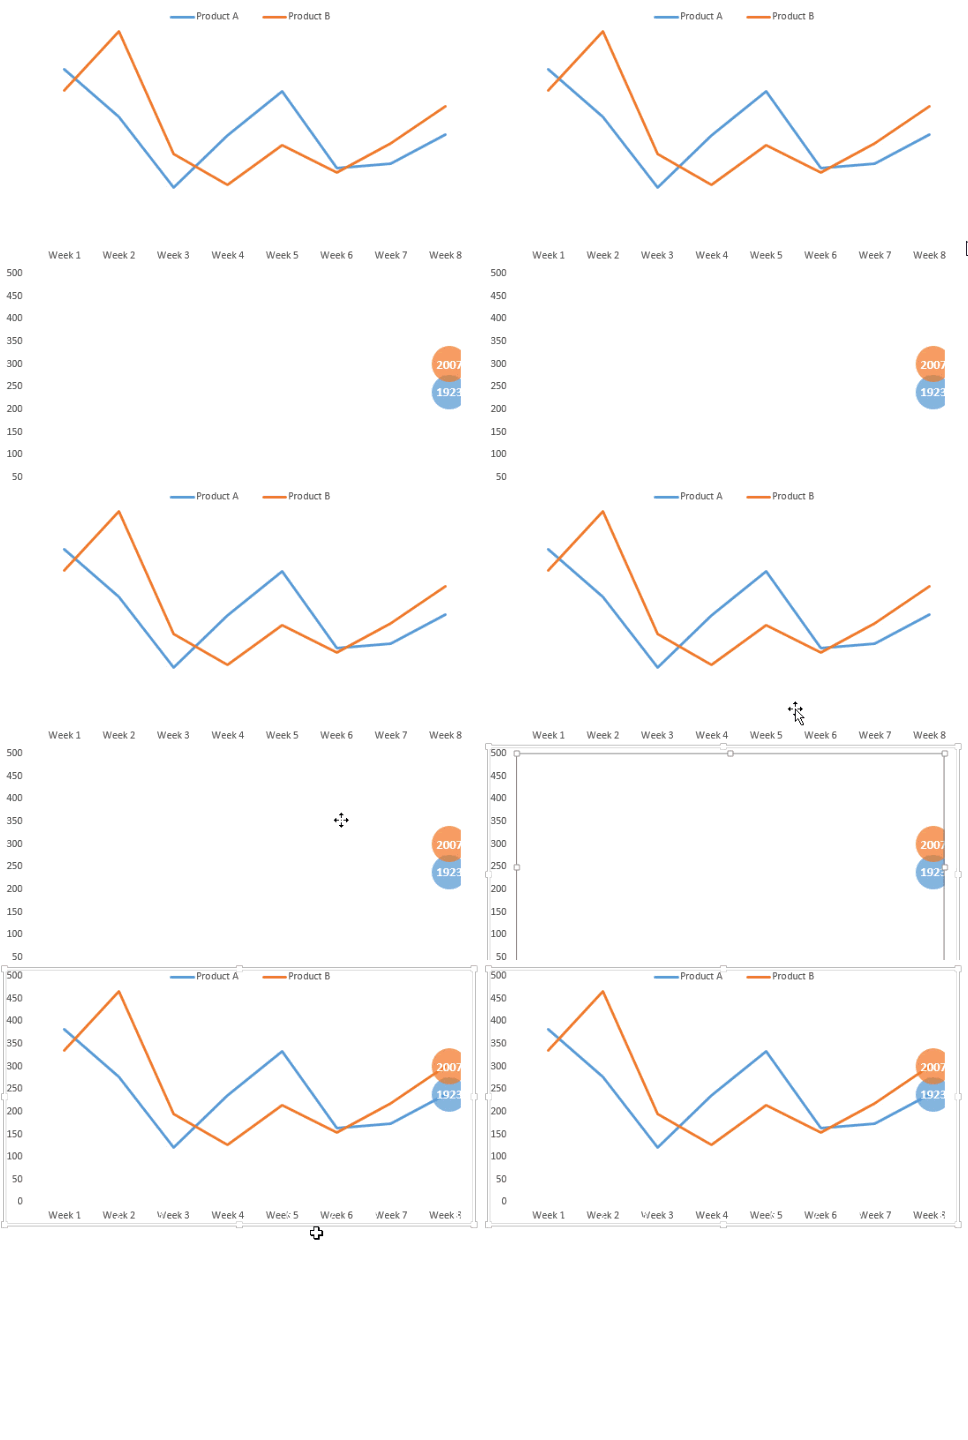
Final Touch – Overlapping the Chart
You can use formatting options to accurately position the two charts

Other Interesting Charts
- Highlight Max Min Points in a Chart
- Customize highlighting any data series in a chart
- Map Chart to Plot Cities
