I have thought of creating this earlier but now that we have DAX and Power Pivot, it makes such a simple and clean solution. Let me help you get your head around this.
In this post I am going to teach you that how can you change pivot table calculations (on different columns / fields) using a slicer. For this post I am expecting you to know the basics of Loading the data into Power Pivot or Power BI, Creating Relationships, writing simple DAX measures and of-course creating a Pivot Table
Like always, lets glance through the data
Consider these 2 Tables
Sales Table – List of Sales Transactions
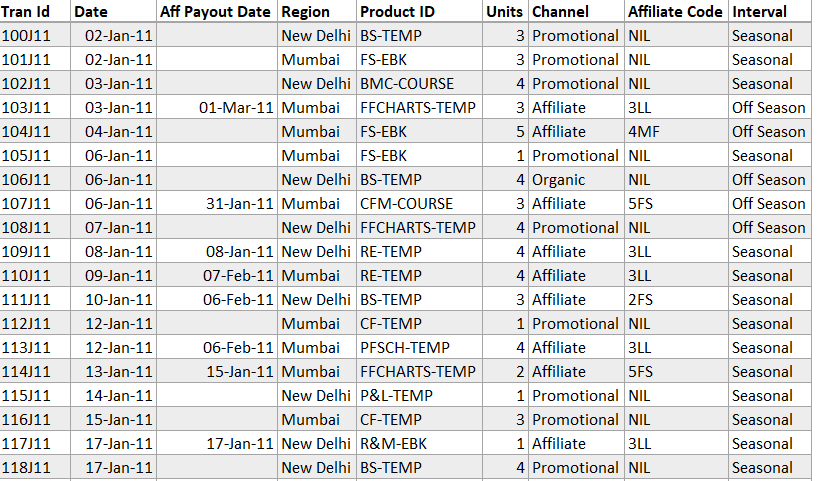
And the Products Table – Unique List of Products (and other related info)

- Loading both of these into Power Pivot / Power BI and Creating Relationships would be the first Step
- Since I am displaying calculations across Years and Months, I’ll create and load an additional Calendar Table as well into Power Pivot / Power BI
The Relationships View
The relationships are pretty straight forward between
- Sales[Product ID] and Product{Product Code]
- Sales[Date] and Calendar[Date]
The Disconnected Table
In order to dynamically choose a calculation (from a slicer) we would need a disconnected table. Create a small table with just one column and load it into Power Pivot or Power BI
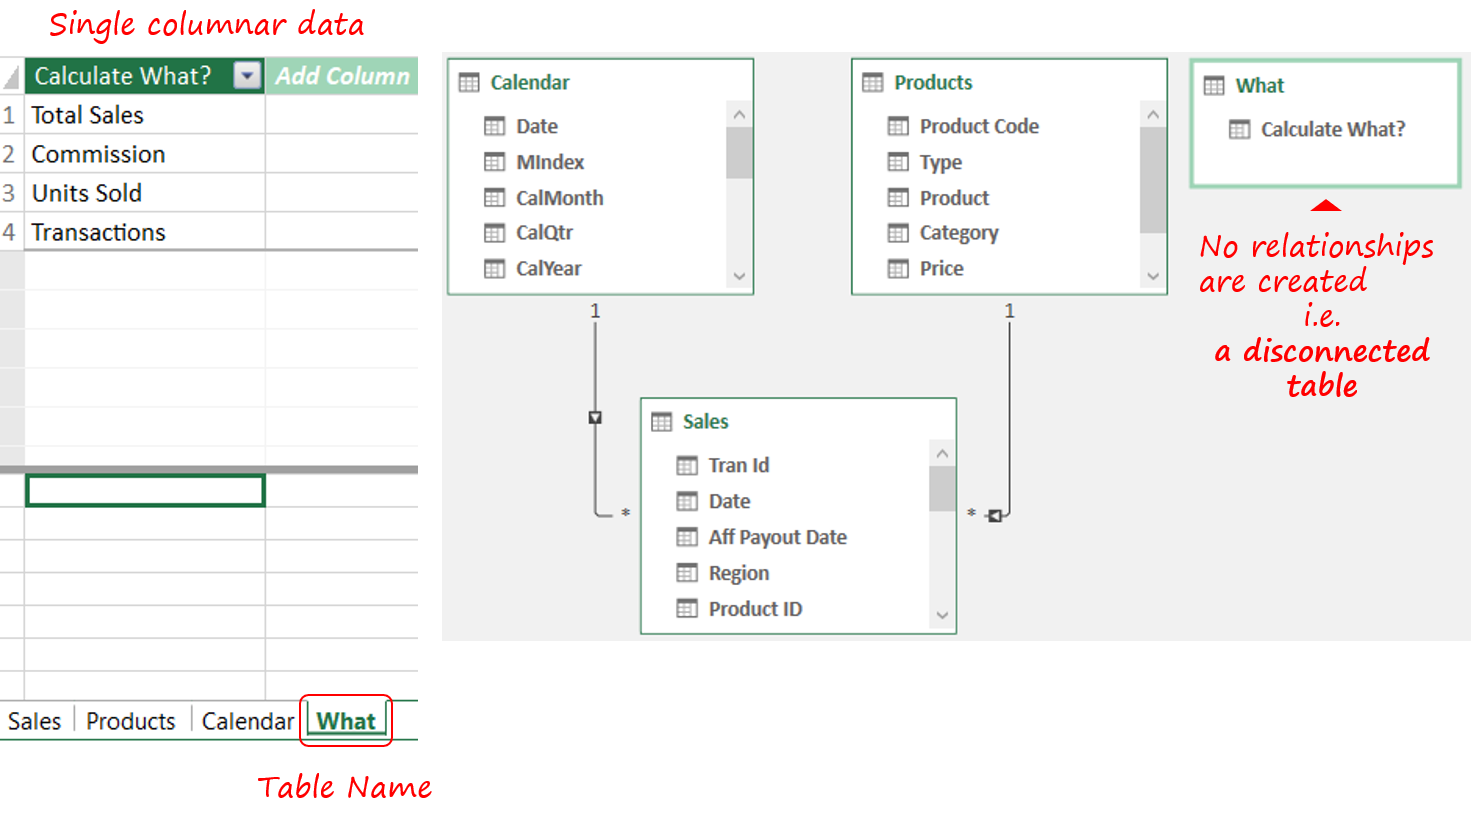
This table will allow us to create a slicer where the user will decide which calculation to run
The Calculations
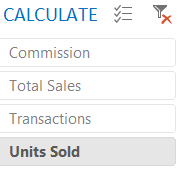
Now if you notice the slicer, the user has the ability to click on any of the 4 calculations and unless we have built the calculations (for sales, total units, transactions and commission) the automation won’t run. Lets write 4 measures to begin with
Total Sales =
SUMX ( Sales, RELATED ( Products[Price] ) * Sales[Units] )
Commission =
CALCULATE (
SUMX ( Sales, RELATED ( Products[Commission] ) * [Total Sales] ),
Sales[Channel] = 'Affiliate'
)
Total Units =
SUM ( Sales[Units] )
Transactions =
COUNTA ( Sales[Tran Id] )
Building Measures for Slicer Selection – I have created 2 more calculations (which can be done in 1 calculation itself but I’d like to break the solution into tit bits of consumable logic)
This measure will either pick the single value selected (in the slicer) or will prompt the user to pick a single selection. If you are still reading, I guess I know your question – But why the hell are we doing it??
Doing it for 2 reasons
- For capturing what the user is selecting in the slicer (and then eventually running that calculation in the pivot)
- If the user tries to be smart and picks 2 slicer options, our calculation should not break down 🙂
Here comes the measure
Selection =
IF (
COUNTROWS ( VALUES ( What[Calculate What?] ) ) = 1,
VALUES ( What[Calculate What?] ),
'Select a Single Calc'
)
All we need to do now is point the [Selection] measure to perform the relevant calculation. Let’s create one last measure to do that
Calculation =
SWITCH (
TRUE (),
[Selection] = 'Total Sales', IF ( [Total Sales] <> BLANK (), FORMAT ( [Total Sales], '$ 0,0.0' ) ),
[Selection] = 'Commission', IF ( [Commission] <> BLANK (), FORMAT ( [Commission], '$ 0,0.0' ) ),
[Selection] = 'Units Sold', [Total Units],
[Selection] = 'Transactions', [Transactions],
[Selection]
)
Because I like to keep my results slick and tidy, notice the use of IF and FORMAT Function (in the above measure) to deck up the results. The last step is the easiest and the most desired step since we started.
Dragging and dropping the [Calculation] in Values 😎
Doing the same in Power BI
- The 4 measures (for [Sales], [Commission], [Total Units], [Transactions]) remain the same
- The relationships remain the same
- See this, if you need to know how to create a Pivot Table and Slicers in Power BI
- The only thing that changes is the final [Calculation] measure. Instead of breaking this into 2 measures (in case of Excel Power Pivot), I am doing all grunt work in a single measure
Calculation =
VAR SelectedVal =
IF (
COUNTROWS ( VALUES ( What[Calculate What?] ) ) <> 1,
'Select a Single Calc',
VALUES ( What[Calculate What?] )
)
VAR IsSales = SelectedVal = 'Total Sales'
VAR IsComm = SelectedVal = 'Commission'
VAR IsUnits = SelectedVal = 'Units Sold'
VAR IsTransac = SelectedVal = 'Transactions'
VAR ElseText = 'Pick a Single Calc'
RETURN
SWITCH (
TRUE (),
IsSales, IF ( [Total Sales] <> BLANK (), FORMAT ( [Total Sales], '$ 0,0.0' ) ),
IsComm, IF ( [Commission] <> BLANK (), FORMAT ( [Commission], '$ 0,0.0' ) ),
IsUnits, [Total Units],
IsTransac, [Transactions],
SelectedVal
)
Once done, repeat the most desired step once again. If you carried the will to read it until here, I am sure you want more.. (download and watch 😀)
If you prefer watching the video..
Similar Cool Stuff
- Change Pivot Value Fields using Slicer and VBA – Another Interesting Post
- Top Product Analysis in Power Pivot & Power BI
- Pivot Table – Challenge Questions
- Find the difference between 2 values in a single column using a Pivot Table
- Find Top x Items – Pivot Table Trick
- Life Saving Pivot Table Tricks