In this post, I’ll talk about an interesting and frankly quite simple, data modeling trick to display the table or the matrix until a selected date. Something like this
Display the Table Until the Selected Date – Video
Consider this Pivot
We have a pivot Table containing month and year against total sales measure. The year and month column have also been used on a slicer.
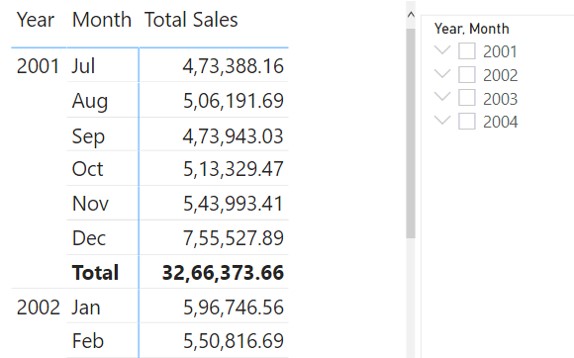
The Problem – Selecting March 2003 (or any month) in the slicer will display the sales of that particular month. However, we want the table to display total sales until the month selected.
The slicer should show the values until the Date Selected and not the values of the period selected.
Let's see how we can do this!
Creating a Disconnected Date Table
I am using the same code for the Calendar table once again to create a new table – Disconnected Calendar. This table won’t be linked to any other table.
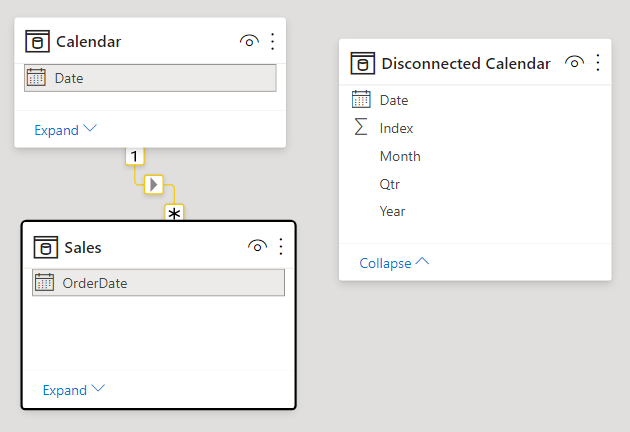
Now, let’s use Year and Month Columns from the disconnected table in the slicer (and not from the linked Calendar Table).
Let’s also create a new measure Stop Date.
Stop Date = MAX ( 'Disconnected Calendar'[Date] )
This measure returns the last date of the month selected on the slicer.
Modifying the Calculation to display Till Date Values
Change the Total Sales Calculation as follows
Total Sales =
CALCULATE (
    SUM ( Sales[SalesAmount] ),
    FILTER (
        'Calendar',
        'Calendar'[Date] <= [Stop Date] -- Display the period until the selected date
    )
)
Now any selections made in the slicer will display the total sales until that month.