Matrix in Power BI is very similar to a Pivot Table in excel. When you create a matrix, by default you cannot use a measure in rows or columns, however, in practical cases you’d need the measure in rows or columns to get the required visual.
In this blog, I will discuss how to use a measure in column of a Matrix Visual in Power BI.
Video – Use Measure in Columns of a Matrix Visual
Consider this Pivot Table
A simple pivot table, where Year and Categories are in rows along with a few measures.
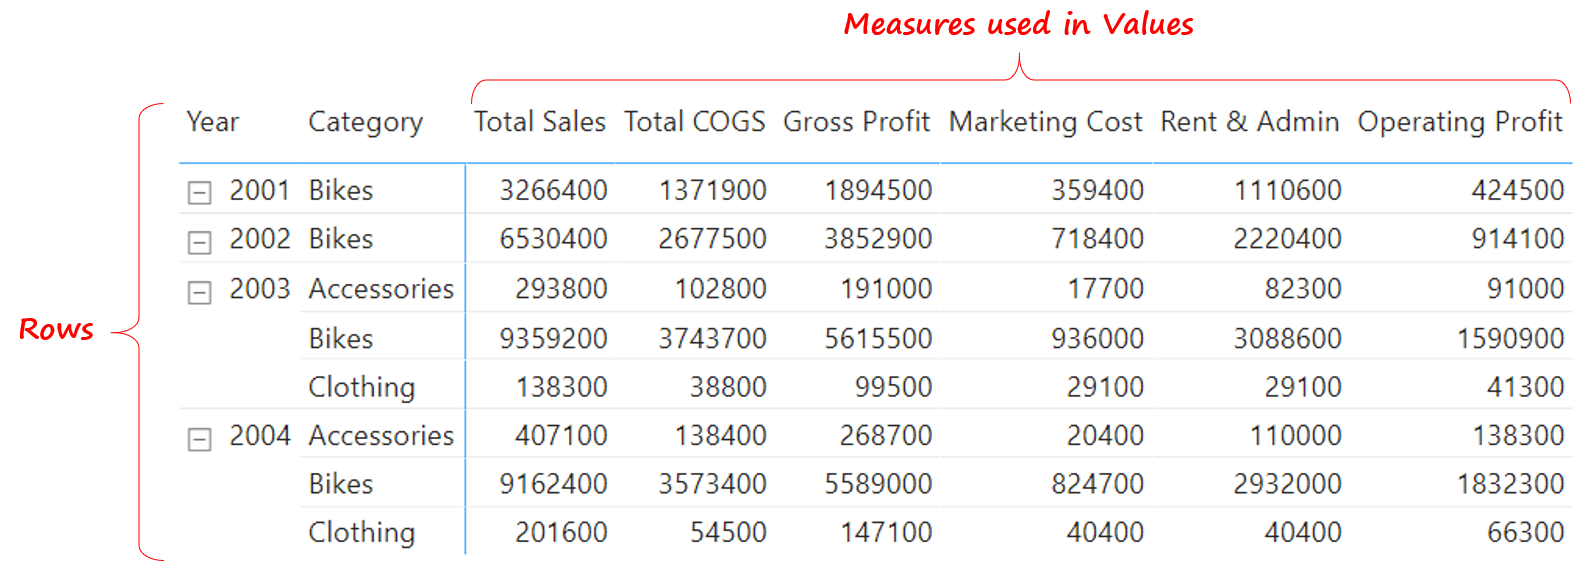
The measures above are part of Income statement (starting with Sales, all the way to Operating Profit) but the problem is, this is not how you’d present an income statement. The income statement is represented in vertical fashion or top-down fashion.
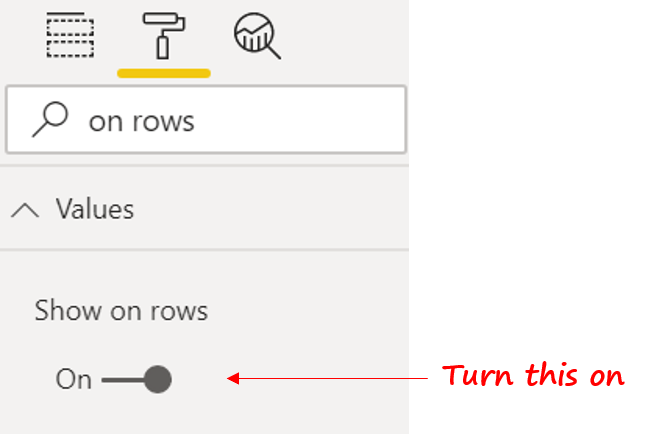
In order to modify the layout of the pivot table, select the pivot table, go to format option and turn 'Show on rows' feature on.
All the measures start to appear on the rows. The result is shown below.
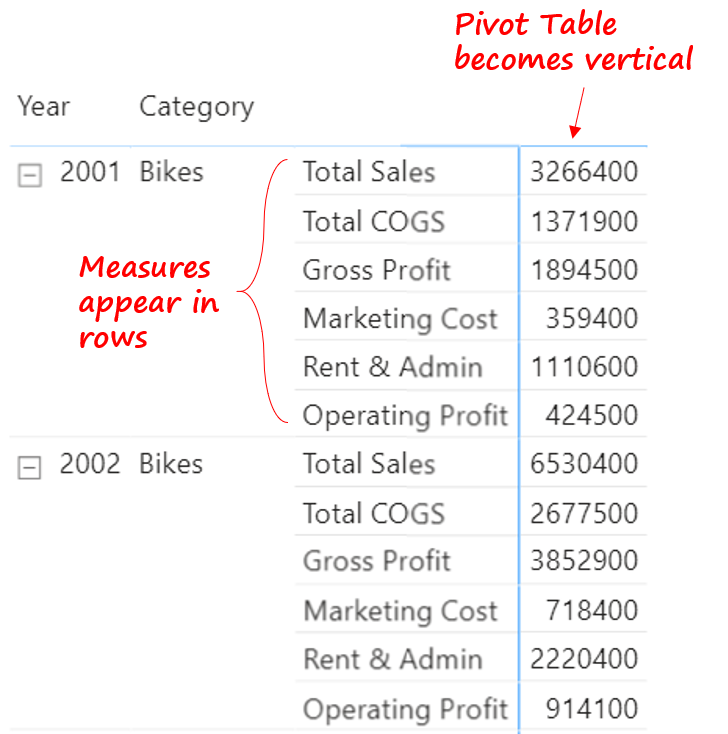
We have moved one step closer to an ideal income statement.
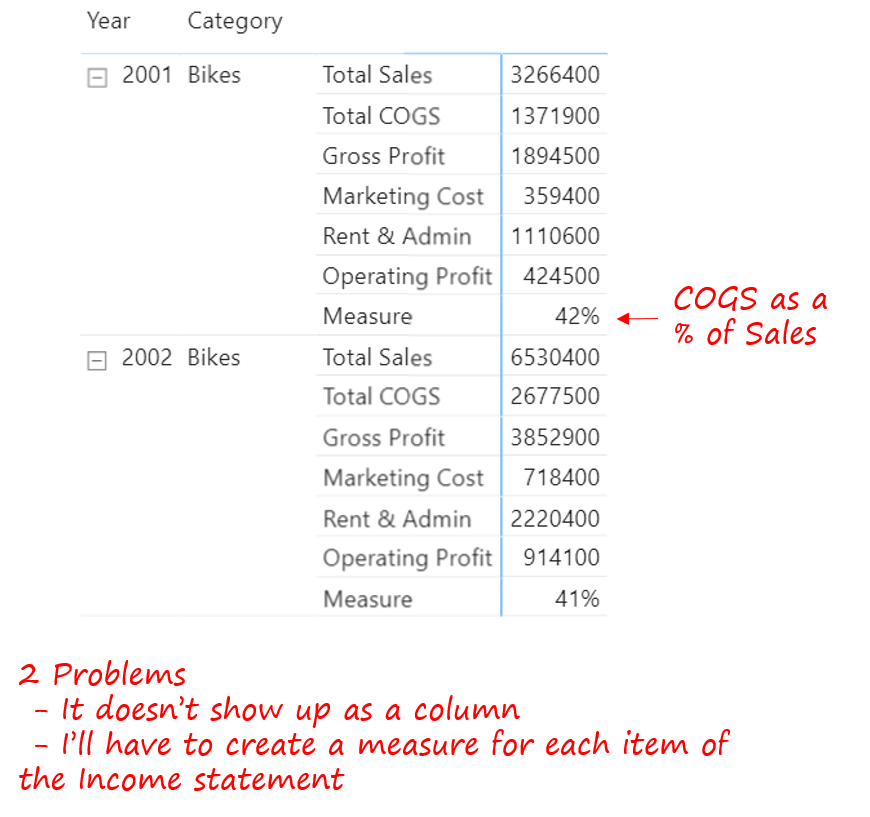
Now let's say, I want to show every single measure as a % of Total Sales i.e. each measure should display the value and % of Total Sales (as columns).
I’d like to add % of Total Sales as a new column in the above Pivot Table.
If I follow the approach to create a measure to calculate percentage and drag it into pivot table, I will face two problems.
- The measure will appear in rows but I want the percentage values to appear in columns.
- I will have to create a lot many % of Total Sales measures i.e. one for each measure.
This is something that I won't be able to do in Power BI. I will use tabular editor to create a calculation group to solve this problem.
To open tabular editor.
- Install Tabular Editor – If you haven’t yet
- In Power BI, go to External Tools >> Tabular Editor.
- Make sure to back up the model before you fiddle around with Tabular Editor.
Using Tabular Editor to place the Measure in Columns of a Matrix Visual
I am going to create a Calculation Group in Tabular Editor.
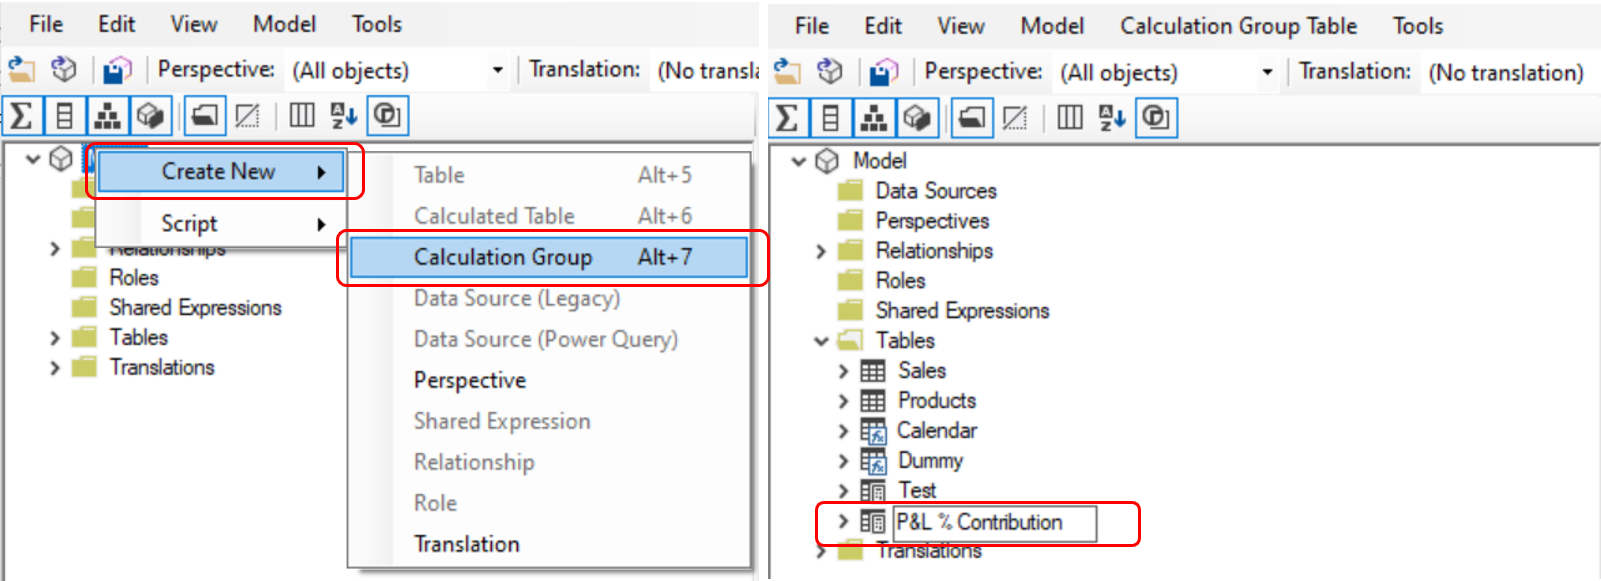
- Right click on Model,
- Select Create New and then select Calculation Group.
- Give a name, I have named it as P&L % Contribution
In this Calculation Group I am going to define a few calculation Items (a calculation item is like a measure but more dynamic).
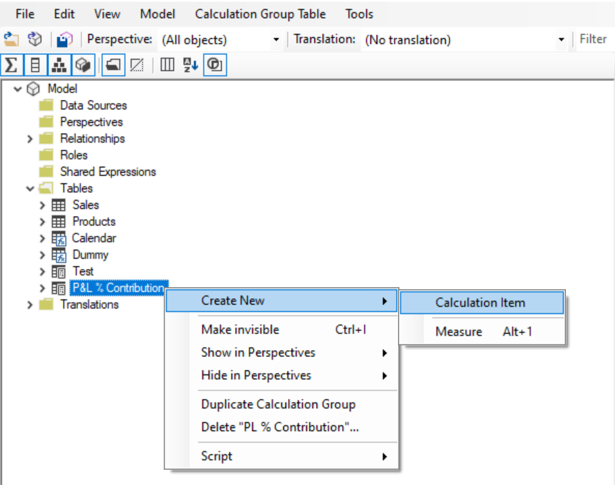
Right Click on the Calculation Group >> Create New >> Calculation Item with the following code
SWITCH (
    TRUE (),
    SELECTEDMEASURENAME () = 'Total Sales', BLANK (),
    FORMAT (
        DIVIDE (
            SELECTEDMEASURE (),
            [Total Sales]
        ),
        '0%'
    )
)
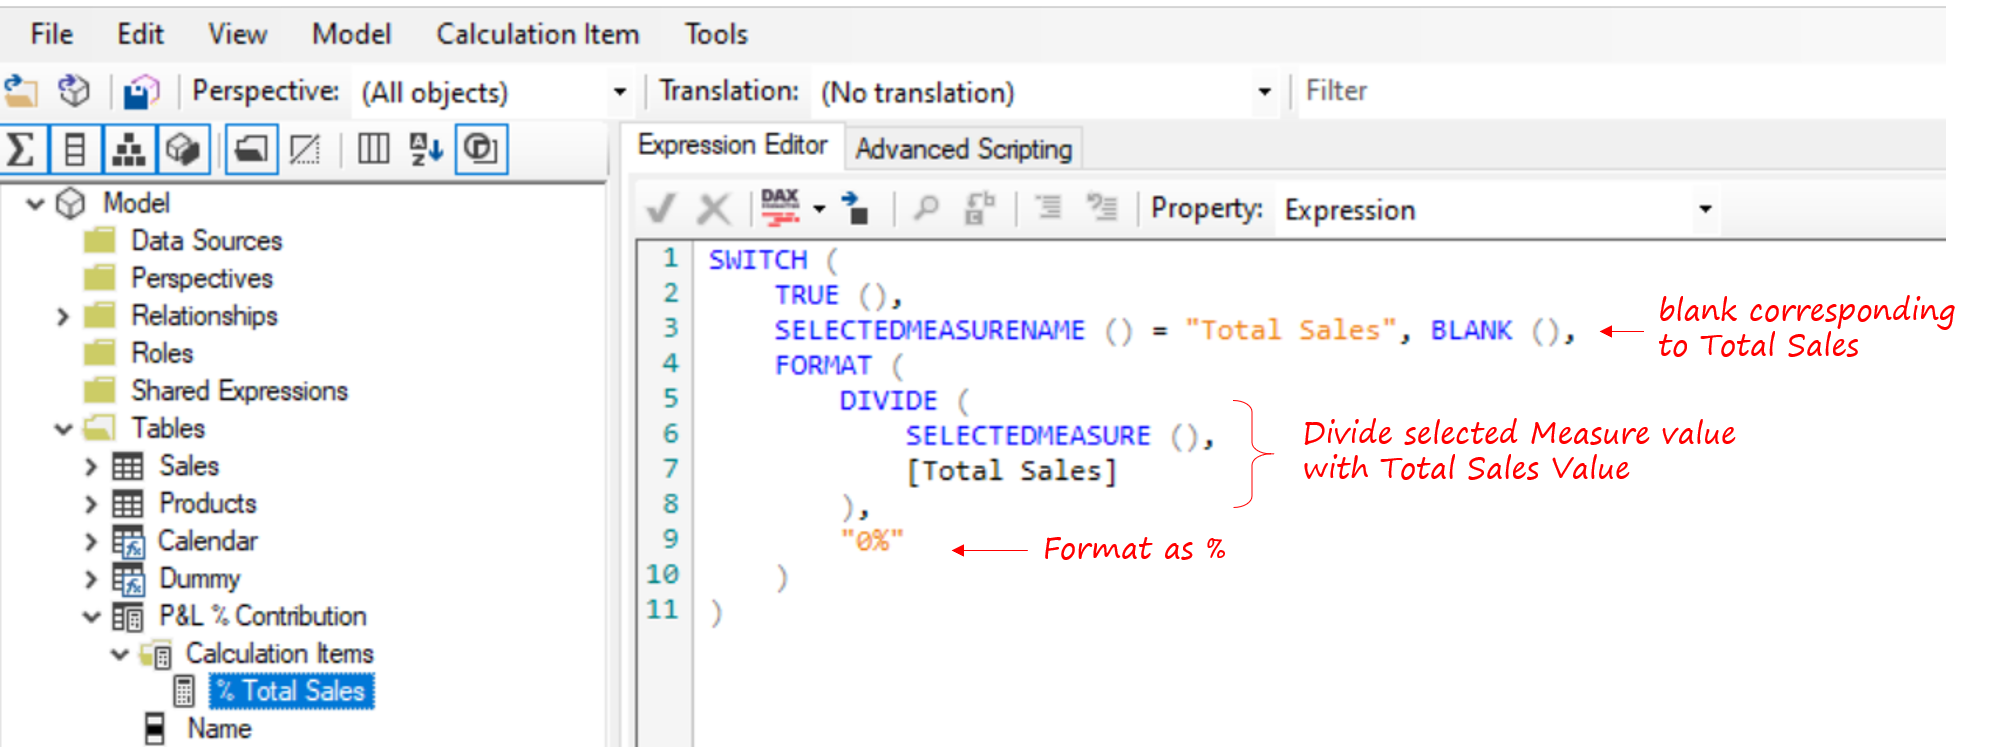
This deserves some explanation
- DIVIDE the selected measure by Total Sales except the Total Sales measure itself.
- SELECTEDMEASURE() is dynamic and takes a look at current measure in the pivot table.
- At the end I have formatted the value as a percentage..
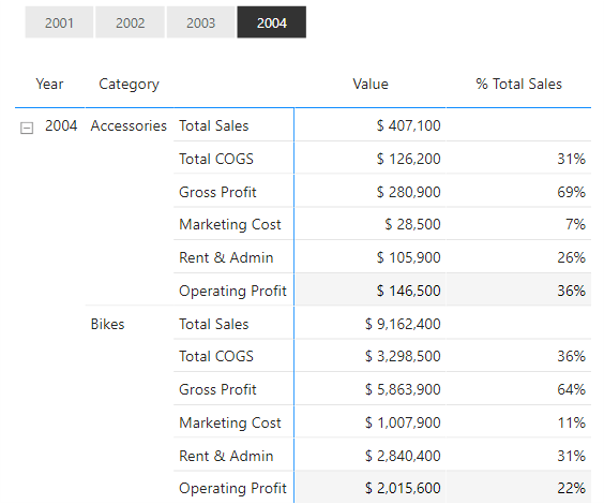
Save the model, go to power BI and hit refresh, you will see the Calculated Group (Name) in the field list. Drag it to your visual to get the % Total Sales.
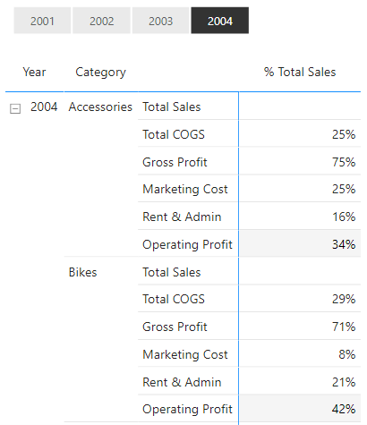
I am not able see values corresponding to each measure, but just the %of Total Sales Values.
To be able to add the values of each measure we need to create another calculation item in our calculation group with the following DAX.
FORMAT (
    SELECTEDMEASURE (),
    '$ 0,0'
)
Save and hit a refresh and you’ll see the values being added to the pivot table.
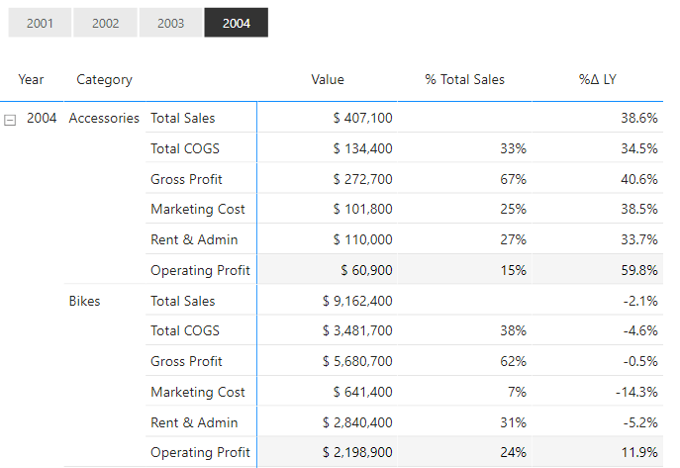
Just like that I can also add another calculation as % Change from LY. See the following DAX code that goes in creating another calculation group
VAR LastYear =
    SELECTEDVALUE (Dummy[Year] ) - 1
VAR CYValue =
    SELECTEDMEASURE ()
VAR LYValue =
    CALCULATE ( SELECTEDMEASURE (), Dummy[Year] = LastYear )
VAR Check =
    LYValue <> BLANK ()
    && CYValue <> BLANK ()
RETURN
    IF ( Check, FORMAT ( DIVIDE ( CYValue, LYValue ) - 1, '0.0%' ) )
Save and Refresh with the following results
A few more DAX Tricks
- Switch between Current Year and YTD Calculation
- Allocation Calculation in Power BI
- Weighted Average in Power BI
- Percentile Calculation in Power BI
- Slab / Tiered Calculations in Power BI