and this was the chart that I presented as my contest entry
Quick brief and Listicles (for random visitors and not so Goodly people ;D)
- This year I got to know about this contest (I guess from some twitter feed) organised by Microsoft
- There is no fee to participate in the contest. It started on 3rd Oct 2016
- There are 4 rounds. Trials, Qualifying Heat, Semis and Finals
- As of date the 1st Round is over and I am headed towards Round 2 – Qualifying Heat
For all Goodly folks and friends, below is a more meaty and a real time talk!
I would obviously not repeat the listicles but give you some of my personal insights about this contest and share my submission files. Well I don’t know since when is the contest happening but it got my attention this time and I decided to participate
So here is what the participants are tested on!
3 things essentially..
- Ability to play with data
- Write simple to complex formulas
- Charting skills to depict a story
Also it has been stated that in the forthcoming rounds (2 and onward) the participants will also be tested on the newer features like Power Query and Power Pivot.
Personally, I am comfortable with the later and as of now I have little experience of working with power query, so let’see how this spans out for me
Here is what I submitted in Round 1 !
I am going to share with you 2 things from my submission
- Formula Based Questions – and my answers
- The Chart that I made from the data
- Although there were a few other questions but they were quite simple, so I am keeping them at bay
Below is the snapshot of the Interactive Chart that I submitted in the contest
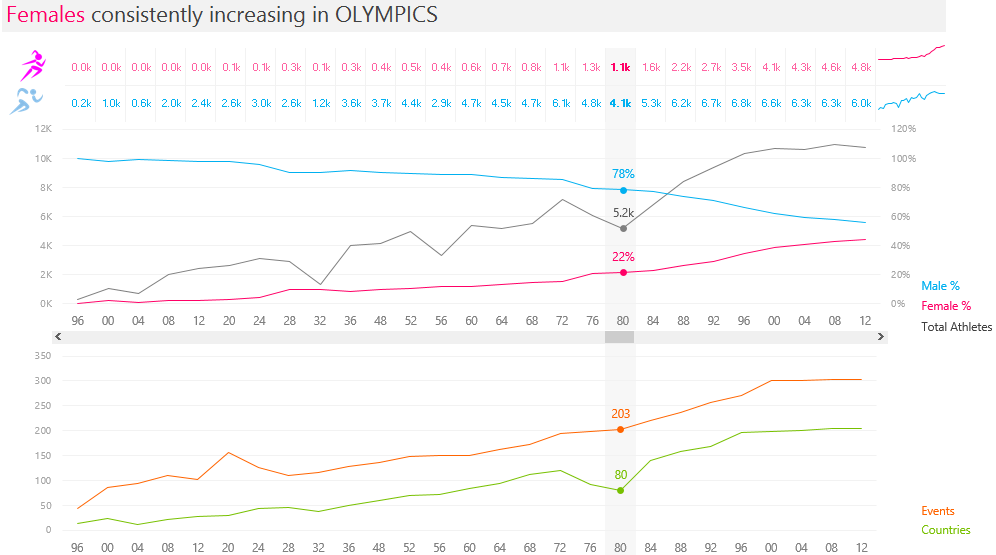
Side note: Our chart did receive a few likes 😀
DOWNLOAD THE EXCEL FILE THAT I SUBMITTED
- This Excel file contains the formula based questions and my solutions
- It also contains the Chart and all the supporting calculations (I tired using a cool trick of integrating conditional formatting in the Chart)
- Quick Challenge – If you were to
- Solve these questions, how would you do it ?
- How would your Chart look like ?
My Observations about this Contest
- Since the excel file that we were given was locked so I could not add more sophisticated visualization techniques (Disconnected Slicers, VBA etc..)
- Also the objective to make the chart was quite broad, so 2 things happened (both good and bad)
- The scope of inferences that could be drawn from the chart were many
- I was simply amazed to see the work of a few fellow participants. The depth of analysis and chart creativity was simply stunning!
Other Important Links
- You must visit and take a look at all the contest entries here (I guess more than 200 people participated) – Excel World Champ Contest (you’ll get the original excel questions files, contest rules, real time conversations here)
- Our Entry was mentioned on Page 4
3 Action Items for you!
- You MUST take a look at all the chart entries, people have really made a killing with their submissions! You’ll never get to see such a board perspective of data visualization and story telling from some of the coolest folks around the world
- Try solving the formula based questions. They are not too difficult
- Post a snapshot of your chart in the comments
I’ll keep you updated on how Round 2 goes for me! Cheers