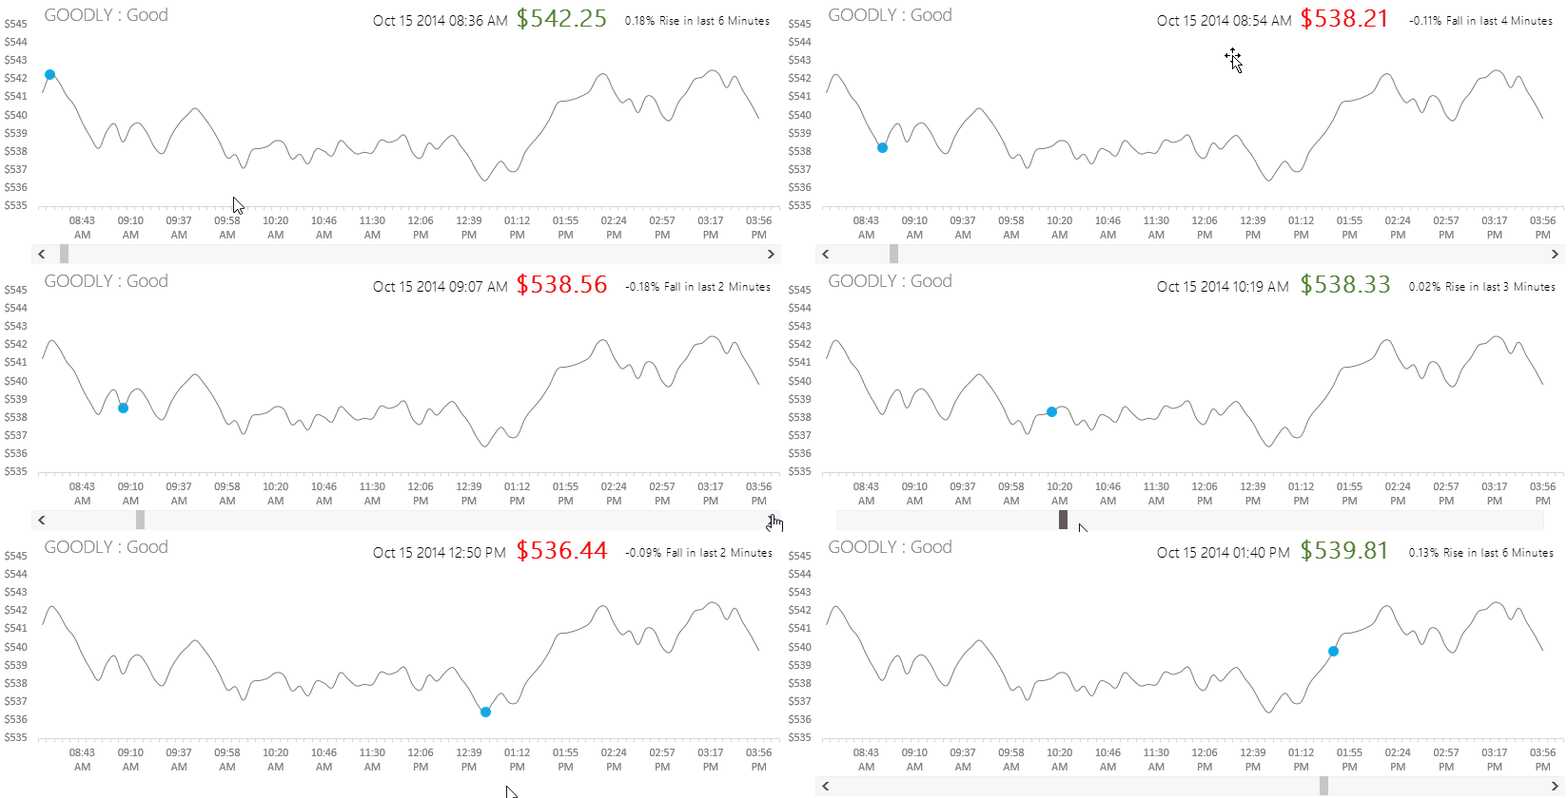
The other day I was tracking a stock on Google Finance, looking at the Stock Ticker Chart I thought.. If I have the data can something similar be made in Excel. So what I have for you today is the recipe for making a Stock Ticker Chart
Ticker Chart Ingredients
- We would need data (stock prices at different times of the day), I have already prepared it for you (just like a cooking show 😛 ) Download Data
- Need a line chart (easily available in the charts gallery)
- Scroll Bar (we figure that out in a while)
Creating the Scroll bar
If you are not seasoned with Excel, this may be a bit new for you. You will find the Scroll Bar in the Developer Tab. Now if you don’t find the Developer Tab I’ll help you activate that
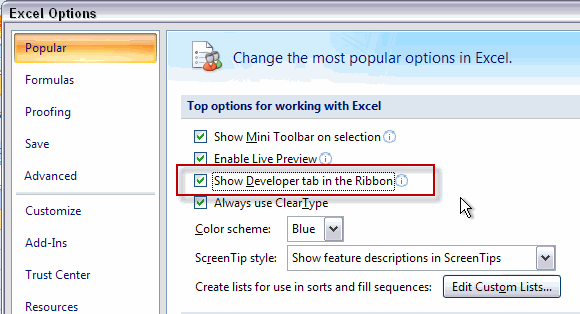
Activating the Developer Tab Excel 2007
- Go to Excel Options Window (Shortcut ALT F I)
- Under the Popular Tab --> 3rd option will be ‘Show Developer Tab’
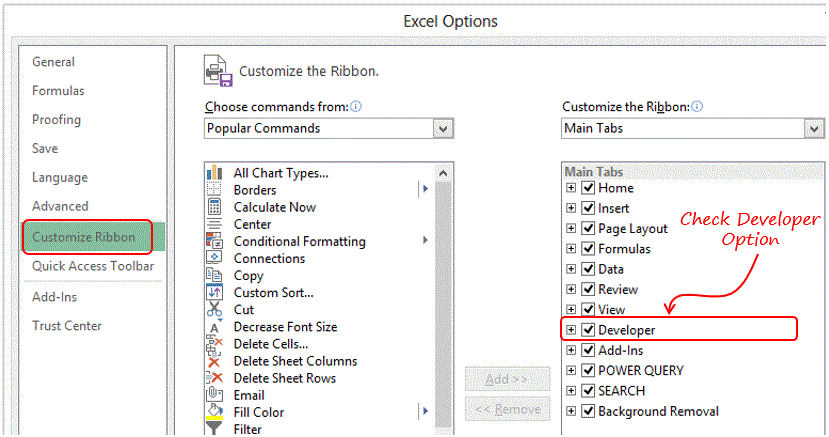
Activating Developer Tab in Excel 2010/2013
- Go to Excel Options Window (Shortcut ALT F T)
- Under the Customize Tab --> Check the Developer Option
- After you have got the Developer Tab, you need to select the Scroll Bar from the Insert drop down
- Note there are two categories Form X Controls and Active X Controls and we are going to choose the Scroll bar from the Form X Controls. WHY? because Form X Controls work both in Apple and Windows, they simple to handle and Active X additionally require some VBA coding (but offer greater utility). For now we are going ahead with Form X Controls
- Simply drag and draw a scroll bar on the sheet (make it wide enough to fit underneath the chart)

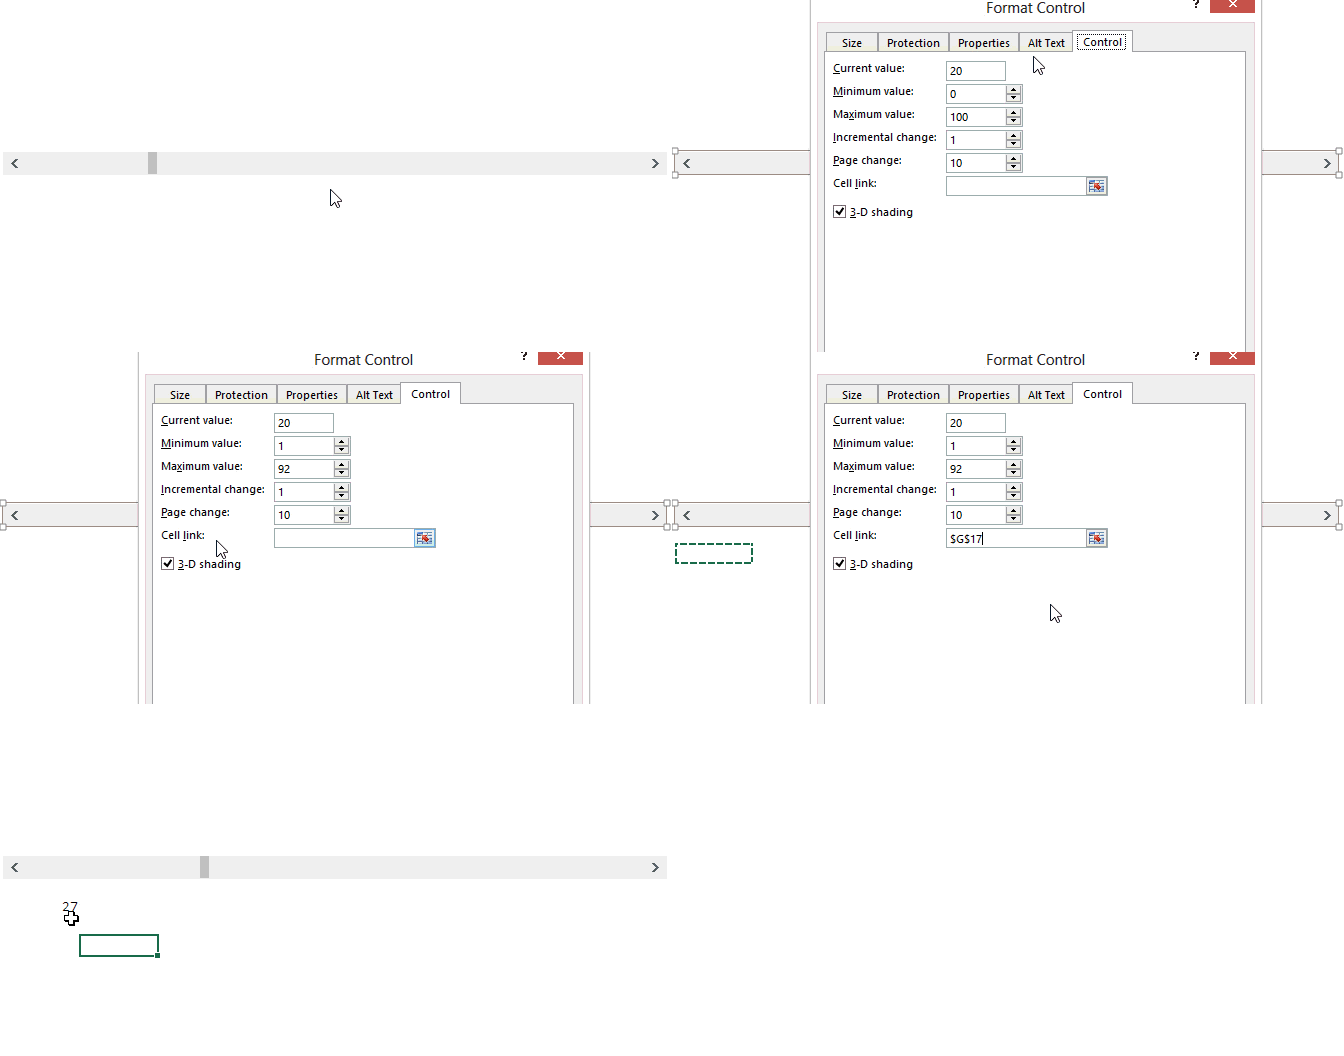
Edit the Scroll Bar Options – Now in order to link the scroll bar to the sheet follow the steps
- Right click on the Scroll Bar and go to Format Control
- Minimum Value is set to 1
- Maximum Value set to 92 (because we have 92 values in our data)
- Link the scroll bar to any cell on the sheet
Dummy Series Formula
We need to create a marker (dot) on the line chart which moves in sync with the scroll bar Take a look at the cover picture. For that we need a dummy series which only picks up the value (from stock price data) that matches the number shown by the linked cell to Scroll Bar. Take a look at the formula below
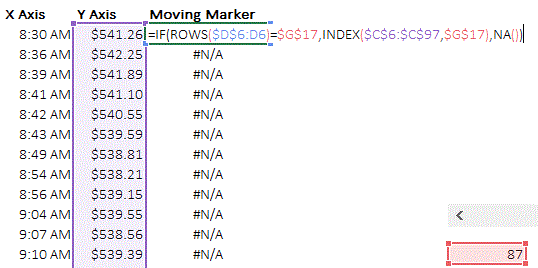
Decoding the formula – The formula has 3 parts
- IF Condition – We are checking if Rows (have created an expanding range) are equal to the linked cell
- IF TRUE – We want INDEX function to pick up that row number (in linked cell) from the stock price data
- IF FALSE – We want NA (choose N/A over zero because, N/A does not appear in the chart, 0 does)
Also notice that the time on the X axis (in the chart shown) is split into larger intervals so that it can fit in horizontal axis. To do that we would need another dummy series with a formula

Decoding the formula – This formulas has also 3 parts
- IF Condition – Checking If the count of rows (again as expanding range) divided by 6 (through the MOD function) leaves the remainder 0
- IF TRUE – If the remainder is 0 then we want the time in the corresponding column (X Axis)
- IF FALSE – If the remainder is not 0 then we want nothing (denoted by empty double quotes)
Drawing the Line Chart
Simply draw the line chart with the stock price data. Check out charts Part 1, Part 2, & Part 3. If you wish to learn more on basics of charting
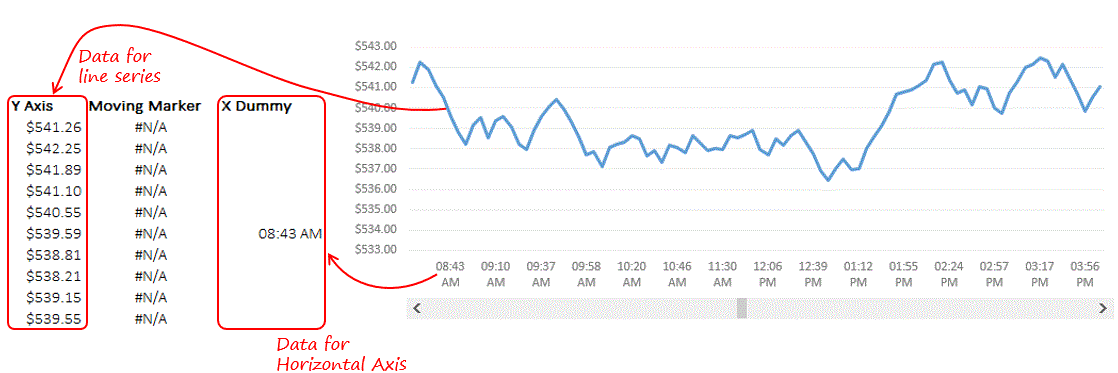
Notice a few things in the chart
- The Line Chart (with stock price data) is neatly placed on top of Scroll Bar
- The Vertical Axis values have been altered to start from $533 to end at $543. This is purely done to show the intra-day variation
- The Horizontal Axis values have been altered to X Dummy values
Adding the Marker to the Chart
- Now add one more data series (which is our Moving Marker Data) to the chart
- Change the series chart type to Line with Markers
- Move the Scroll Bar to see if the marker is shifting
Since you place one line chart on top of the other, you may face problems in selecting the data series. You can go to the FORMAT Tab (appears when you click on the chart) and in the extreme left from the drop down select the chart item you want. Then use SHIFT F10 to get to the click menu (its is smart trick 😎 )
Additional Effects
In the chart above you also see the price color changing, time and Data and % change since last few minutes when you move the Scoll Bar
- I have done that using the simple Index Formula (extract the time where the marker is currently positioned)
- Then use the camera tool to place a dynamic picture on top of the chart!
- And a few formatting changes and I am done!
Other Interesting Charts
If you wish to hear more from us, please subscribe to our updates. Put down your Name and Email ID under the subscribe option in the right panel
