One of the most common calculations in business is to compare Budget v/s Actual.
In the times of Excel this calculation was a pain in the ass, with tons of scattered vlookups, sumifs, pivots on top of pivots across hidden sheets to finally arrive at that one pivot table that management wanted. One could really sweat over the ordeal of doing the grunt work!
But now that we have Power BI with a lot more power, I am going to share with you how can you do clean and dynamic Budget v/s Actual calculations in Power BI using DAX!
Let’s jump right in..
Consider these 2 tables..
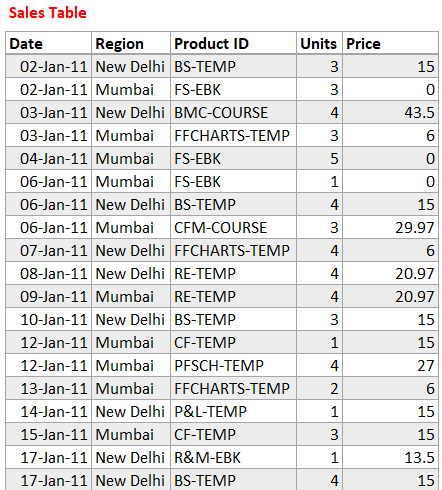
In the sales table we have…
- Five standard columns – Date, Region, Product ID, Unit Sales and Unit Price
- And this is 20 months of sales data from Jan 2011 to Aug 2012
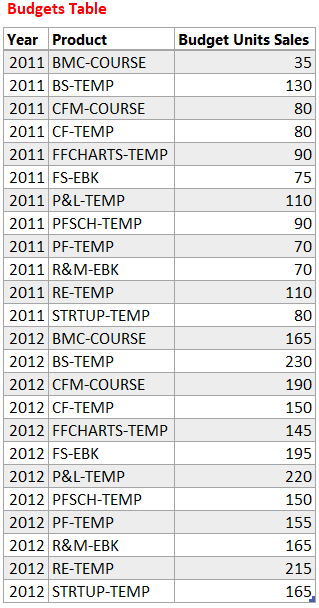
In the Budgets Table we have – 2 Years of Annual Budgets (Unit Sales) by Product ID
Actual v/s Budget Calculation
In order to do the most coveted Actual v/s Budget calculation we need the following
- Actual Sales – Which is easy (Price x Units)
- Budget Sales – Although this is just the sum of Budget Units column from the Budgets table but then unless you want to see the budgets only at the year level, we’ll need to allocate the annual budget to individual transactions (from sales table). This would enable you to answer magical questions like..
- Are my quarterly sales meeting the target ?
- Are my monthly or even daily sales meeting the target ?
Real quick a measure for Actual Sales
Actual Sales =
SUMX ( Sales, Sales[Units] * Sales[Price] )
Relationship Between Sales and Budgets Table
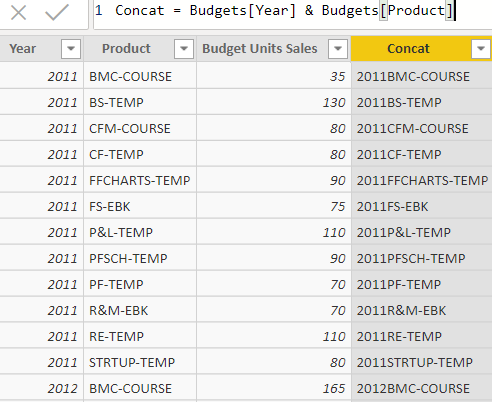
On the face of it there doesn’t seem to be a relationship between the two tables. But but.. If you think about it we can actually concatenate Year and Product ID from both tables to create a One to Many Relationship
So in the Budgets Table – Create a Concat column
And in the Sales table again a Concat Column
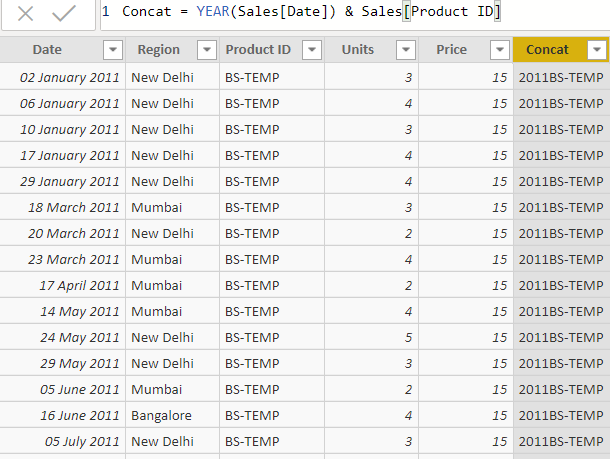
Rest is obvious, create a one to many relationship between Budgets (one side) and Sales (many side) using the new Concat column created
Measure for Budget Sales
There could be two approaches to solve for budget sales
- By creating a column in the Budgets Table for the number of transactions for the Product and it’s Year
- Or directly writing a measure without any column (also my preferred choice)
#1 – The Column Method
Adding a new column in the budgets table
Per Transaction Target =
DIVIDE ( 1, COUNTROWS ( RELATEDTABLE ( sales ) ) ) * Budgets[Budget Units Sales]
Let me explain this
- First I try to find how many transactions (rows) matching with the current product and year
- Dividing by 1 and multiplying that with annual unit sales budget (for that product) will return the per budgeted units per transaction. Nothing complicated, It’s 7th grade unitary method math
A few more things
- Rather than equally dividing the budgeted units between the sales transactions, one could argue an allocation based on parameters such as Last Year Sales or Product Level Contribution to Total Revenue
- But for now, the idea is to explore allocation. So I am going the easiest way to explain
Now that we have the per transaction budget I can write a simple measure
Budget Sales =
SUMX ( Sales, RELATED ( Budgets[Per Transaction Target] ) * Sales[Price] )
In english the above measure would mean like this..
- For every row of the sales table, do a Vlookup and get’s its transactional level target units
- Multiplying each transactional level target units with price would give the Budget Sales (in value terms)
#2 – The Measure Method – Creating columns is not that a bad idea but why not try creating a measure instead. Which means that I’ll have to count the transactions of each product and it’s year within the measure. Try this..
Budget Sales Measure =
SUMX (
    Sales,
    DIVIDE (
        1,
        COUNTROWS (
            FILTER (
                ALL ( Sales ),
                EARLIER ( Sales[Concat] ) = Sales[Concat]
            )
        )
    ) * Sales[Price] * RELATED ( Budgets[Budget Units Sales] )
)
Before you freak out.. I’ll explain
- The COUNTROWS part counts the number of transactions with current Product and Year
- Dividing that with 1 and multiplying that with Unit Sales gives me transaction level Budget Sales
Now see this !
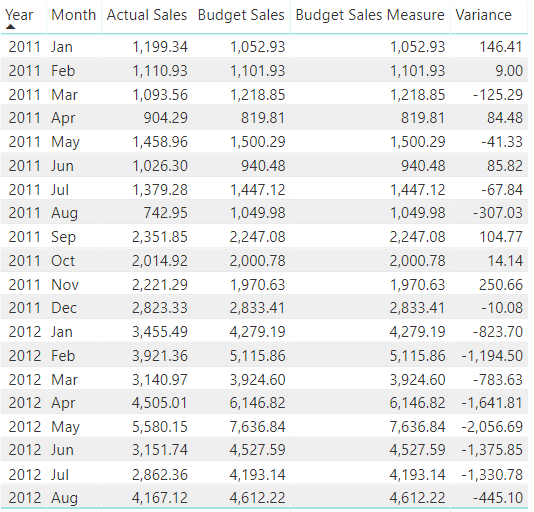
- The Budget Sales (Column Method) and Budget Sales Measure give me the same results!
- Just in case you din’t notice.. I have the Actual and Budget Sales split by the Month, even though the budgets table was annual by the product. I don’t know about you but I got thrilled!
- Obviously the Variance Measure = [Actual Sales] – [Budget Sales Measure]
All good but there is a catch..
If dug carefully, you’ll be tempted to ask – why the hell do I not meet the budgets in any of the months in 2012, variance being negative for all months in 2012.
Any guesses??
The Budget Data was annual (for the entire year) but the sales was only until Aug 2012. That means that my annual target is allocated between 8 months of sales transactions. That’s unfair!
Allocating Budgets to Months in Sales Table
The simple calculation would be, Adjusted Budget = Allocated Budget x Sales Days in Sales Table / 365
Doing that in DAX is slightly tricky. See this measure
Adjusted Budget =
SUMX(
    Sales,
    VAR __FirstDate =
    CALCULATE(
        STARTOFYEAR(Cal[Date]),
        Sales[Concat] = EARLIER(Sales[Concat])
    )
    VAR __LastDate =
    CALCULATE(
        EOMONTH(LASTDATE(Sales[Date]),0),
        ALL(Sales),
        Sales[Concat] = EARLIER(Sales[Concat])
    )
    VAR __DaysinYear =
    CALCULATE(
        COUNTROWS(Cal),
        ALL(Cal),
        YEAR(Cal[Date])=RELATED(Budgets[Year])
    )
    VAR PctAllocation =
    DIVIDE(
        VALUE(__LastDate - __FirstDate + 1),
        __DaysinYear
    )
    RETURN
    DIVIDE(
        1,
        COUNTROWS(
            FILTER(
                ALL(Sales),
                Sales[Concat]=EARLIER(Sales[Concat])
            )
        )
    ) * RELATED(Budgets[Budget Units Sales]) * Sales[Price] * PctAllocation
)
To put this simply
- I am finding out how many days have passed in the current year in the sales table and take a percentage over total days in year
- Then multiply the Budget Sales Measure to Percentage of Days passed by in the sales table in the current year
- Full budget can be allocated when the sales table reaches the end of Dec
Again a few more things
- Right now the budget allocation is equal between the months
- But one could argue an allocation based on a certain weight (like seasonality). Point Taken!
- I am keeping it simple to explain you how allocation works
Also the New Variance will be
New Variance = [Actual Sales]- [Adjusted Budget]
Now see this again!
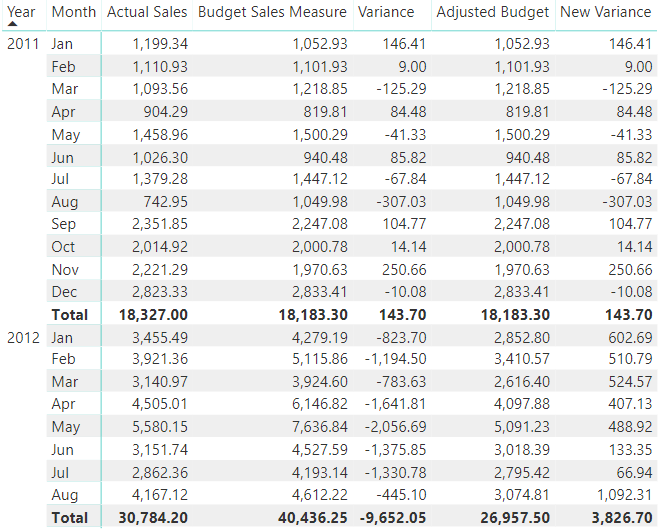
Notice the difference
- In 2011 Budget Sales Measure and Adjust Budget have no difference since the budgets are fully allocated
- But in 2012 the total Budget is 40,436 and only 26,957 has been allocated until Aug 2012
- And ofcouse the New Variance seems be in-line
- All this is dynamic so it’ll auto adjust when new data kicks in.. Mind it! 🙂
How differently would you have solved this, have a simpler measure? Share it in the comments
More on DAX
- Top Selling Product Analysis in Power Pivot
- DAX Puzzle 1
- DAX Puzzle 2
- DAX Puzzle 3
- How to Correctly use IF in Power BI
- Change Pivot Table Field Calculations with a Slicer
- Calculating Fiscal Year in Power BI