In Power BI (DAX) there is no function as =BOTTOMN() unlike it’s opposite =TOPN(). In this post I’ll make an attempt to show you how can you still do a Bottom Anslysis, in other words anlayse data from least to most.
We’d be using a conjunction of functions (like FILTER and RANKX) to create a =BOTTOMN() like function in DAX. Strap in, let’s start
Interested in watching the Video first ?
Consider the following
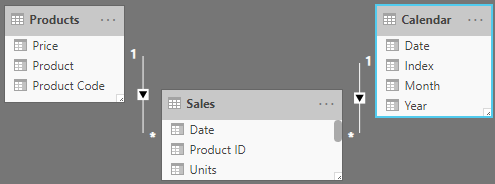
A simple Data Model – 3 Tables (Products, Calendar and Sales)
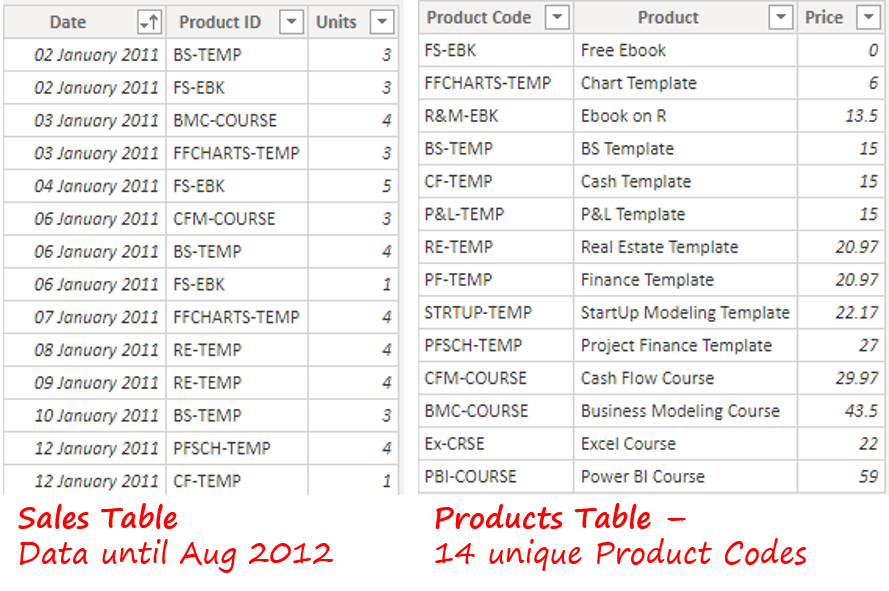
Now take a look at the Sales and Products Table
And a Measure for Total Sales
Total Sales =
SUMX(
	Sales,
	RELATED(Products[Price]) * Sales[Units]
)
And Finally I have this Pivot Table (Matrix Visual)
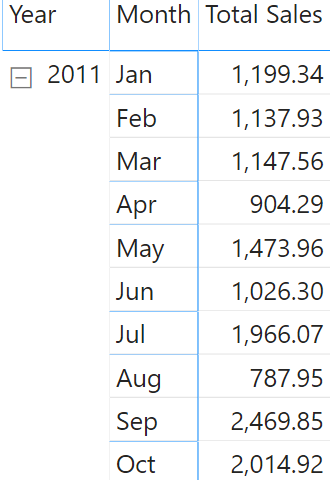
- On Rows – Calendar [Year] and Calendar [Month]
- Values – Total Sales Measure
Doing Bottom N using DAX
Now I want to know the sales of the least selling product for each month?
This question would have been a lot easier had it asked for Sales of the Top Product because we have a TOPN function but we don’t have a BottomN.
Approach – To solve this problem, I’ll first..
- Rank the products by Sales in Ascending Order (least first)
- Then keep only the sales for the least
- Show that value in the Pivot
As a quick check let me drag the Product (Product Table) and check the least sales for the month of Jan
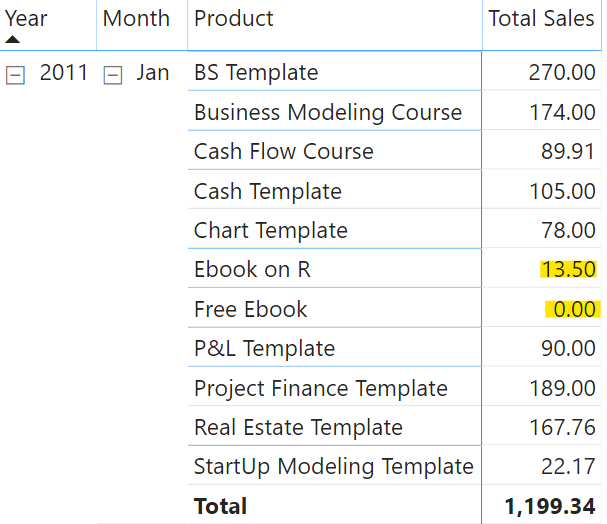
Note that
- The Free Ebook was priced 0 so no sales.
- Therefore I want to capture the 2nd least selling i.e. Ebook on R – the sales of which are $13.50
- Plus this should happen at the month level and not when I drag the product to the Pivot Table. In other words against the Month Total (1,199.34), I should see the sales of the least selling product (13.50)
Creating a BottomN Measure
Consider this measure to find the sales of the least selling product.
Least Sales for Product =
CALCULATE(
    [Total Sales],
    FILTER(
        Products,
        RANKX(
            Products,
            [Total Sales],,
            ASC,
            Dense
        ) = 2
    )
)
Guess I need to explain a bit here..
- The RANKX does the ranking of all the Products for the Current Month (filter context) and arranges them in Ascending order of sales (least first).
- The FILTER applies a further condition – Keep the 2nd least sales i.e. removing the Free Ebook for which the sales will always be 0.
- CALCULATE will calculate the Total Sales for filtered rows
- This also means that if 2 products tie for Rank = 2, the measure will SUM them both and show the result!
If I drag this measure in the Pivot, it shows what I needed. Sweet!
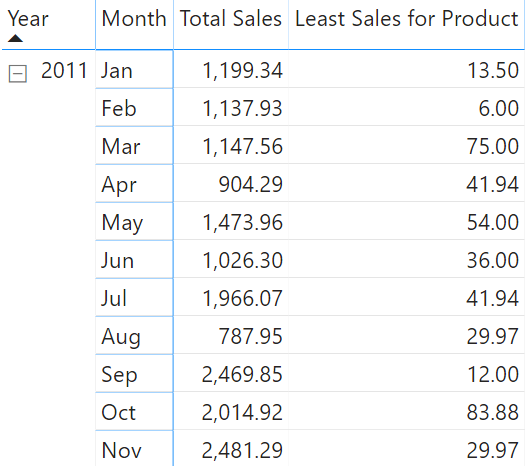
Pretty obvious, you show this to your boss and the very next question is – Hey which product is this? Can I have the name of the Least Selling Product?
Finding the Least Selling Product Name
You need to understand that we are trying to find a text value (product name), which means SUM, SUMX, RANKX.. none of these will work because they return numbers and we instead want to fetch a text value. Thanks to CONCATENATEX. (works just like any iterator function with a few additional features), we’d be able to do just that.
See this measure
Least Selling Prod =
CONCATENATEX(
    FILTER(
        Products,
        RANKX(
            Products,
            [Total Sales],,
            ASC,
            Dense
        ) = 2
    ),
    Products[Product]
)
- The FILTER and RANKX remain the same.
- The Wrapper CONCATENATEX will concatenate the product name from the filtered Table.
Drag that in the Pivot. Holy Cow!! We now have the Name of the Least Selling Product.
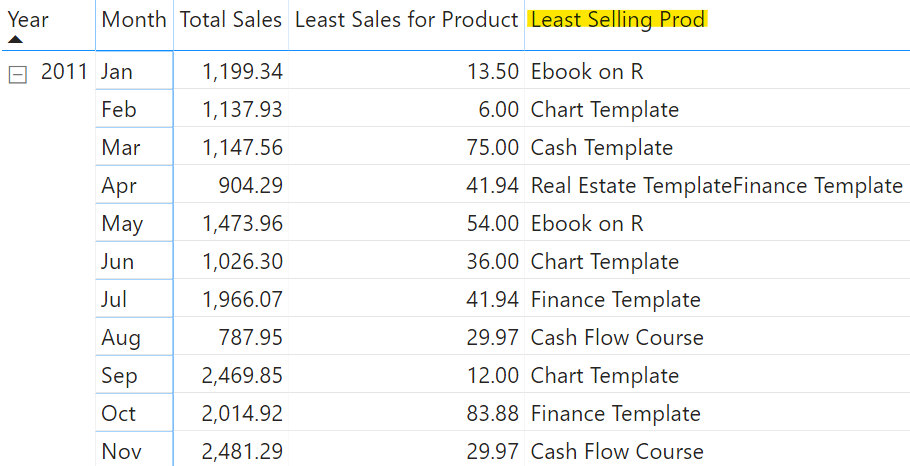
Modifying the Measure
Now obviously you can play with the above measure in case you’d want to see bottom 3 products instead of 1. I made simple tweak!
3 Least Selling Prod =
CONCATENATEX(
    FILTER(
        Products,
        VAR Ranked =
            RANKX(
                Products,
                [Total Sales],,
                ASC,
                Dense
            )
        RETURN
            Ranked >= 2 && Ranked <=4
    ),
    Products[Product]
)
- Created a Variable: Ranked
- And now comparing Ranked against 2 conditions. Ranked >=2 and Ranked <=4
- Which will return 3 bottom products in the Filtered Table
And dragging that in the pivot table will show up not so pleasing like this!
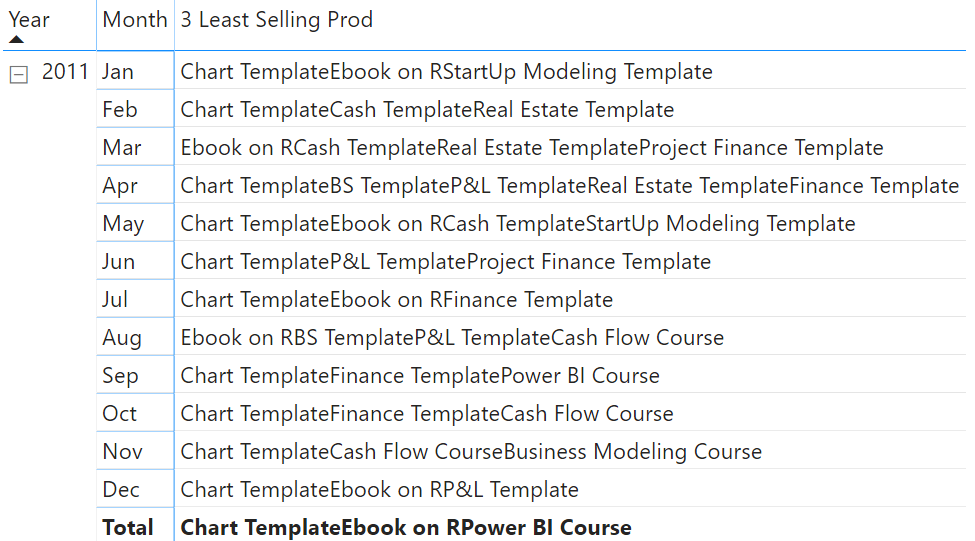
Although this is correct, but the what the hell.. the 3 product names are concatenated. Certainly not what boss wants to see
Let’s welcome the 3 part of CONCATENATEX – Delimiter (which is optional). I’d prefer the products to be in separate rows. Making another tweak to the Measure by adding a delimiter
3 Least Selling Prod =
CONCATENATEX(
    FILTER(
        Products,
        VAR Ranked =
            RANKX(
                Products,
                [Total Sales],,
                ASC,
                Dense
            )
        RETURN
            Ranked >= 2 && Ranked <=4
    ),
    Products[Product],
    UNICHAR(10)
)
UNICHAR(10) means convert 10 (ASCII code for enter) to a literal character as a delimiter. Since I can’t type the “enter key” so I used the UNICHAR to type it for me 😎 How do you like the result now!
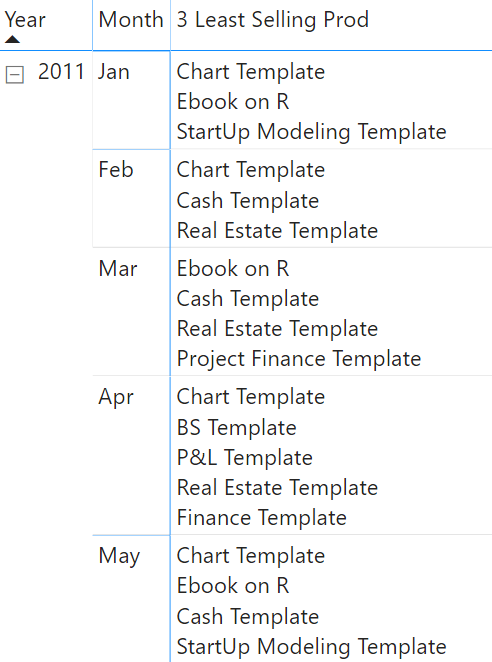
Notice that we have tie in the Month of Apr (4 products have tied as bottom 3 products). If you are any bit curious and still hanging with me, you’d ask..
Can I also get the Total Sales along with Product Names ?
Modifying the Measure even further..
It’s pretty slick how DAX works, and I am guessing that you must have guessed the solution. See this measure!
3 Least Selling Prod =
CONCATENATEX(
    FILTER(
        Products,
        VAR Ranked =
            RANKX(
                Products,
                [Total Sales],,
                ASC,
                Dense
            )
        RETURN
            Ranked >= 2 && Ranked <=4
    ),
    Products[Product] & ' | ' & FORMAT([Total Sales], 0) ,
    UNICHAR(10)
)
Notice the highlighted part. Along with getting the Product Name, I have concatenated (using &) the Total Sales Measure and formatted it to no decimals.
You’d be happy to see the pivot table now.. (we have the product and the sales value for the 3 least selling products)
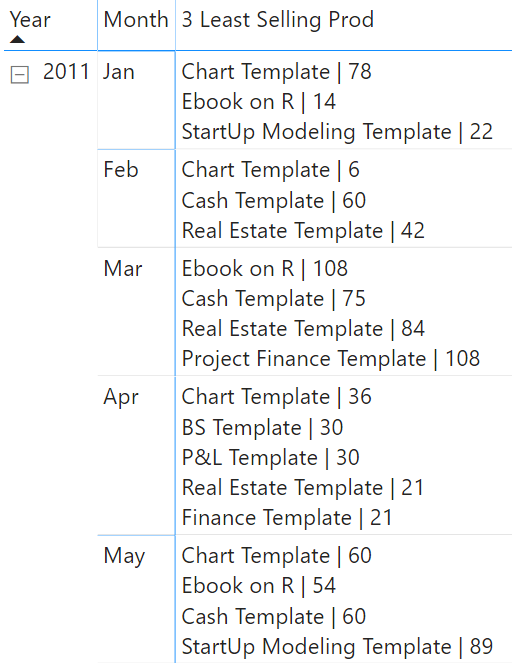
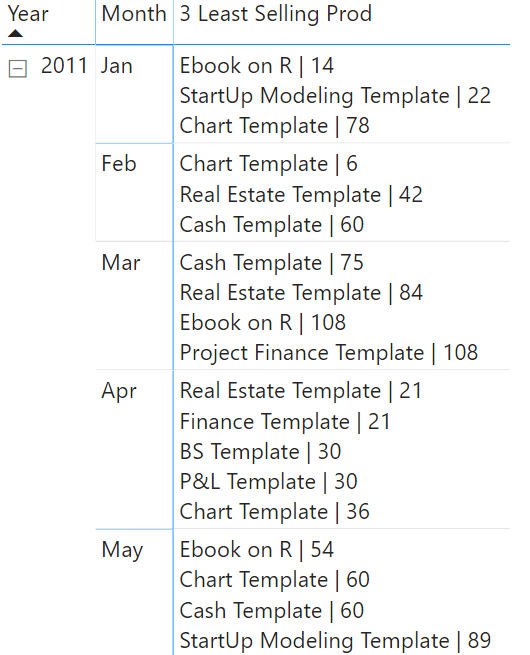
Looks good but hang on.. Should’t the product be sorted in the order of Total Sales (least first)? Let’s make the last modification to our measure and add the Sort Order to CONCATENATEX
3 Least Selling Prod =
CONCATENATEX(
    FILTER(
        Products,
        VAR Ranked =
            RANKX(
                Products,
                [Total Sales],,
                ASC,
                Dense
            )
        RETURN
            Ranked >= 2 && Ranked <=4
    ),
    Products[Product] & ' | ' & FORMAT([Total Sales], 0) ,
    UNICHAR(10),
    [Total Sales],
    ASC
)
I added two more parts to the formula
- Sort by Expression – Total Sales
- Sort Order – Ascending
and Voila! Look at what we have created!
Drop in a comment if you found this useful or if you’r looking for something different.
Some more good stuff using DAX
- Analyse Top Selling Products
- Set off Invoices from Receipts – DAX Challenge
- DAX & Data Modeling Tip Card
- Actual v/s Budget Calculations