Here is another interesting DAX Challenge for your grey cells.
Consider this simple Sales Transaction Data
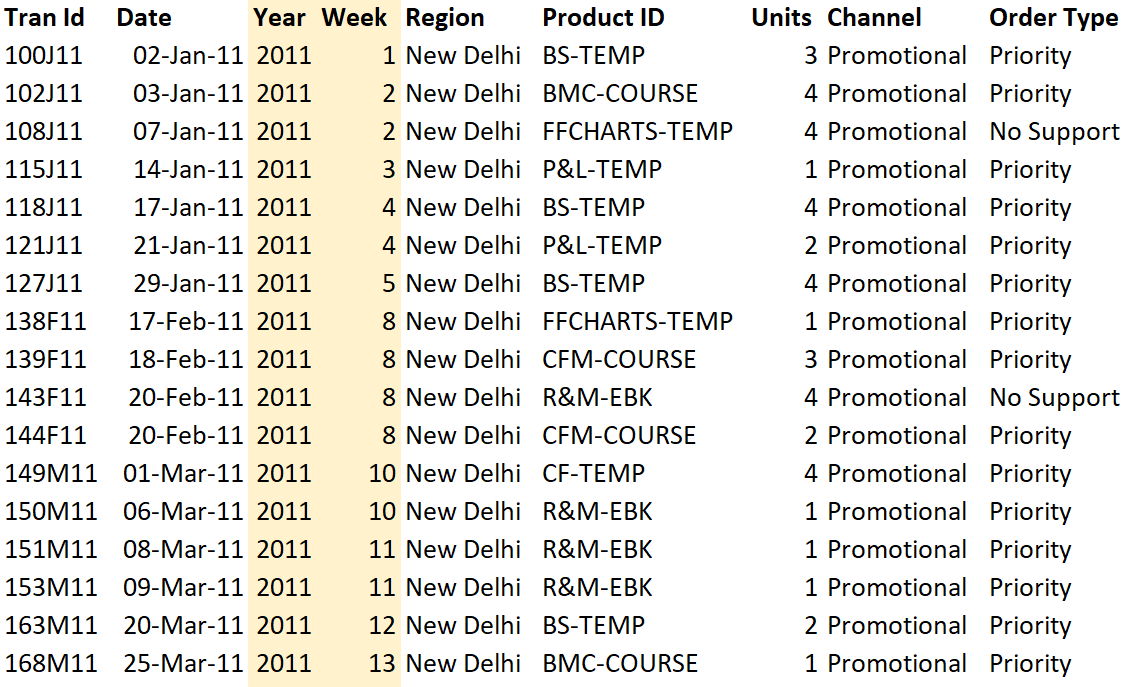
- The columns are self explanatory
- The Year and Week columns have been created to explain the problem, you won’t find them in the dataset.
The Problem
Find the count of consistent selling products in the last 3 weeks.
Let me explain.. Consider this (rough work) simple Pivot table created from the above data.
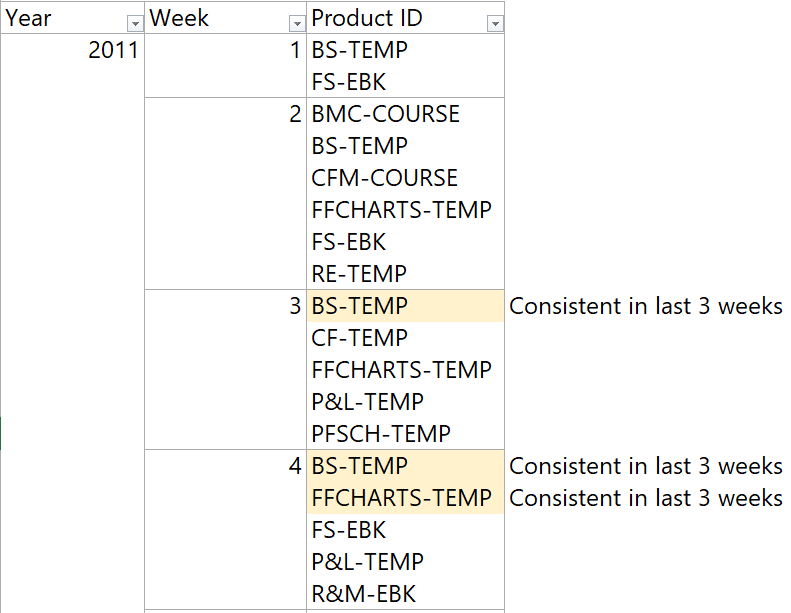
I have placed Year, Week and Product ID in rows of the Pivot Table and I can see which products have been consistently selling.
- 3rd Week – 1 Product (sold consistently from week 1 to 3)
- 4th Week – 2 Products (sold consistently from week 2 to 4)
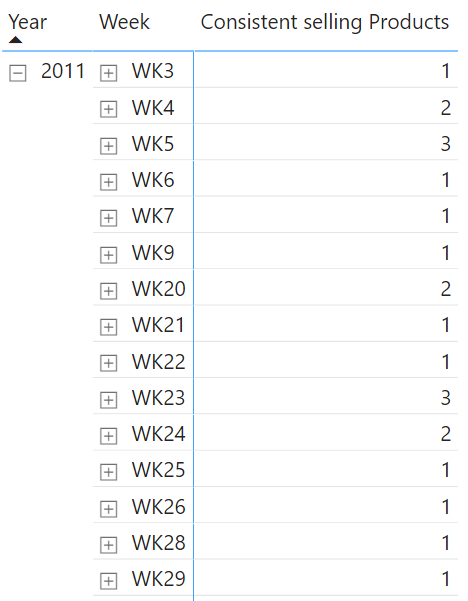
Your output in Power BI should look like this..
The Rules
- Use a Date Table if you want.
- Solve this using a single DAX Measure without changing the structure of the data.

Get going and post your answers – DAX Code + Snapshot of the result in the comments below
Solution – Consistent Selling Products
More DAX Challenges
- The SUMX Problem – My Fav
- Calculate Upgrades
- Growth from Previous Non-Consecutive Date
- Calculate New Subscribers Added
- DAX Crossword
- How much is the Accrued Commission
.
Learn DAX from Scratch !!!
A comprehensive course to learn DAX step by step and solve real time problems in Power BI.
DOWNLOAD THE COURSE OUTLINE | ENROLL IN THE COURSE