A common problem is calculating running total in Power BI. You can possibly do a running total against Dates (very common) and against Non-Date Values like Products or Customers (which is not so common).
Let’s tackle both of these!
Running Total Video
Consider this Data Model
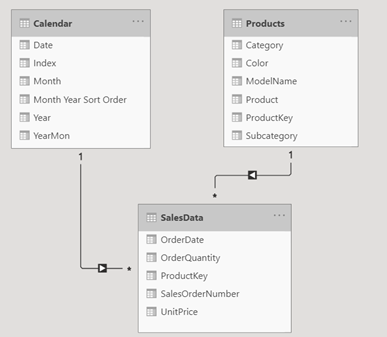
The Calendar (Date) and Products table are linked to the Sales forming a one to many relationship.
Now consider this Pivot Table, where I have placed Years and Months (from the Calendar Table) and a Measure for Total Sales
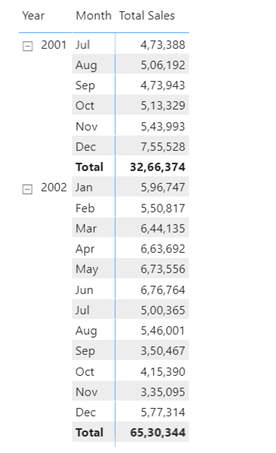
The requirement is to create a running total across all months until the end.
Running Total for Dates
Here is the measure that works
Monthly Running Total =
IF(
    [Total Sales] <> BLANK(),
    CALCULATE(
        [Total Sales],
        FILTER(
            ALL('Calendar'[Date]),
            'Calendar'[Date] <= MAX('Calendar'[Date])
        )
    )
)
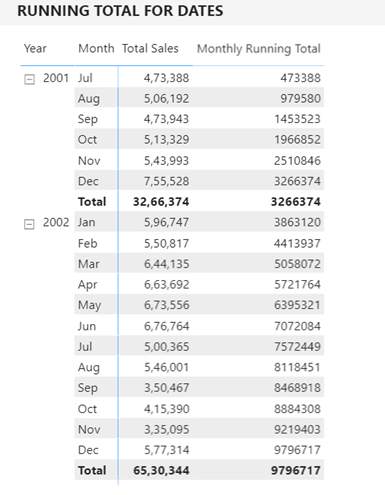
The Logic for the above measure goes something like this
- Find the last day of the month which is MAX(Calendar[Date]).
- Then see how many dates in the entire calendar (date column) are less then equal to the last day of the month.
- Calculate Total Sales for all Dates that match the above criteria.
This is very difficult! Now let’s move on to the more tricky and less common problem – Running Total against Text Column
Running Total for Non Date or Text Values in Power BI
We again start with a pivot table but this time we have Products sorted in descending order of Total Sales
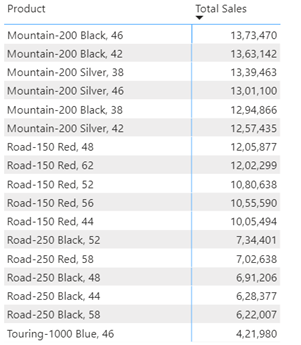
The Logic –
- The problem with text values is that you cannot write a condition to return all text values <= max text value. That doesn’t work!
- So I’ll have to assign a rank (number) to each product in order of Total Sales.
- Then I can expand my condition to sum all sales values <= to the rank of the current product.
Here is an interim measure that calculates the rank of each Product in the order of Total Sales
Product Running Total =
    RANKX(
        ALL(Products[Product]),
        [Total Sales],,
        DESC,
        Dense
    )
See the results..
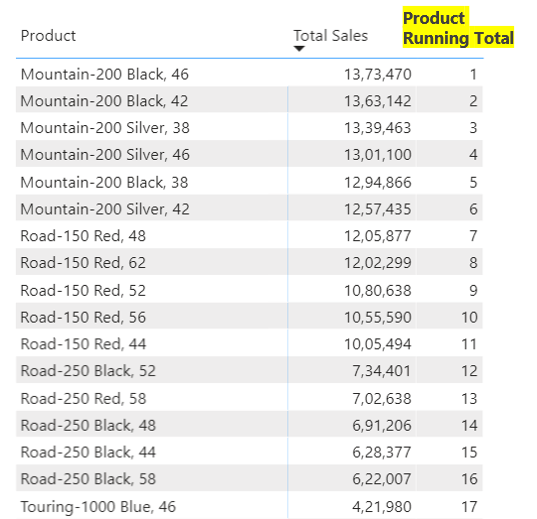
Alright let’s build this measure further and sum all values <= to the rank of each product displayed, that would be a Running Total for the Products.
See this revised measure
Product Running Total =
VAR PdtRank =
    RANKX(
        ALL(Products[Product]),
        [Total Sales],,
        DESC,
        Dense
    )
VAR RunningTotal =
    CALCULATE(
        [Total Sales],
        FILTER(
            ALL(Products[Product]),
            PdtRank >= RANKX(
                        ALL(Products[Product]),
                        [Total Sales],,
                        DESC,
                        Dense
                    )
        )
    )
RETURN
    IF(
        [Total Sales] <> BLANK(),
        RunningTotal
    )
Now the above DAX certainly doesn’t look friendly but focus on the highlighted part.
- The FILTER function creates a table for all the products which are <= to the current rank of the product.
- That is pretty much all I need to wrap the CALCULATE around to get me the running total of Sales across Products.
See the results
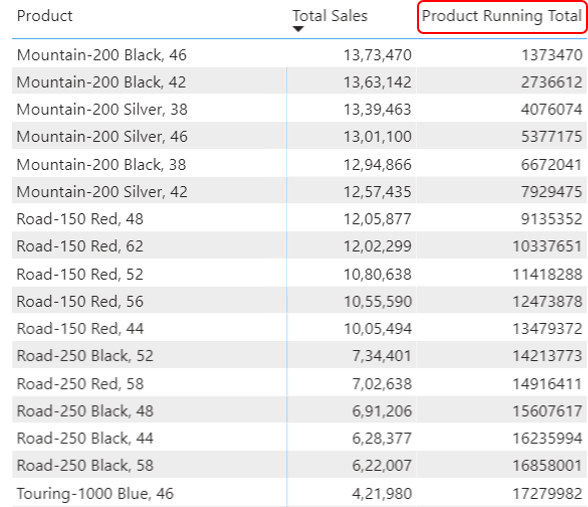
A few more DAX Calculations
- Calculate Fiscal Year in Power BI
- Calculate Growth over Previous Non-Consecutive Date
- Calculate Percentiles in Power BI
- Change a Measure using Slicer
- Create Slab / Tier based Calculations
- Top Product Analysis
- Bottom Product Analysis