Fellas, it’s time for another DAX Challenge! This time, with a slight twist in a simple DAX Calculation
Hear me out!
Consider this Sales Data
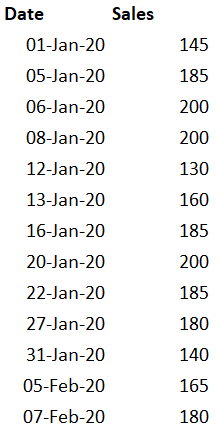
2 simple columns – Date and Sales Amount
The Problem
You have to calculate the growth in sales over previous date.
The Twist – that might seem simple but catch is, the dates are non consecutive, so you need consider the previous available date. For instance
- 5 Jan’s 185 should be compared to 1st Jan’s 145
- And 5th Feb’s 165 should be compared to 31st Jan 140 and so on.
- You get the idea now.
The Rules
- Feel free to create a Date Table if you need to.
- No helper columns / helper tables are allowed.
- Use of Power Query to modify the data structure is a NO NO.
- In short, just deliver the result in a single DAX Measure ✔️
The Output
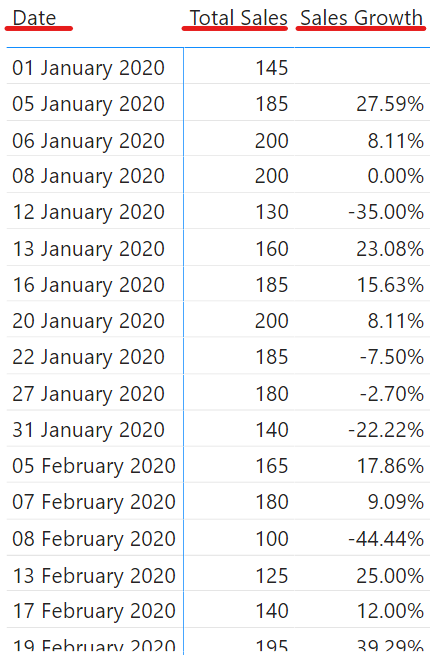
It should be a simple 3 columnar table that displays
- Date
- Total Sales
- and Growth over (available) Previous Date
here is how it should look like..
Post your Answers
- Give it a shot and post your answers in the comments below. I’ll post my solution by next week.
- 3 Early birdies (ones who post the right answer and the earliest) will get an exclusive shout-out in answer’s video
Get going! Cheers
Here is Solution

And of course the DAX Code!
Total Sales = SUM(Data[Sales])
Growth =
VAR PrevDate =
    MAXX(
        FILTER(
            ALL(Data[Date]),
            Data[Date] < SELECTEDVALUE(Data[Date])
        ),
        Data[Date]
    )
VAR PrevSales =
    CALCULATE(
        [Total Sales],
        FILTER(
            ALL(Data[Date]),
            Data[Date] = PrevDate
        )
    )
RETURN
    IF(
        PrevSales <> 0 && [Total Sales] <> 0,
        [Total Sales] / PrevSales - 1
    )
Want more of these DAX Teasers?
.
Learn DAX from Scratch !!!
A comprehensive course to learn DAX step by step and solve real time problems in Power BI.
DOWNLOAD THE COURSE OUTLINE | ENROLL IN THE COURSE