Vanilla SUM and MAX calculations are pretty straightforward in Power BI. But every once in a while you may come across slightly twisted calculation such as find the MAX value and then SUM them. In this post, I will discuss how to find the SUM of MAX values in Power BI.
Sum of Max Values in Power BI – Video
Consider the following Data
I have Calendar, Customers and Products tables linked to the Sales table via one to many relationship.

I also have a pivot table displaying the sales by year and by month.
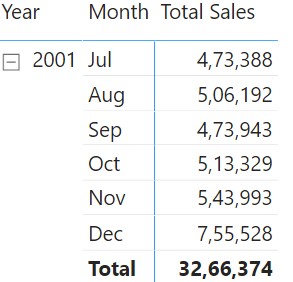
Now, I want to find the sales of MAX selling product each month inside the pivot table.
Calculating MAX Sales by Product for each Month.
This can be done by creating a new measure as follows:
Winning Prod Sales =
MAXX (
    Products,
    [Total Sales]
)
Dragging this measure to the pivot table, I'll be able to see the following result.
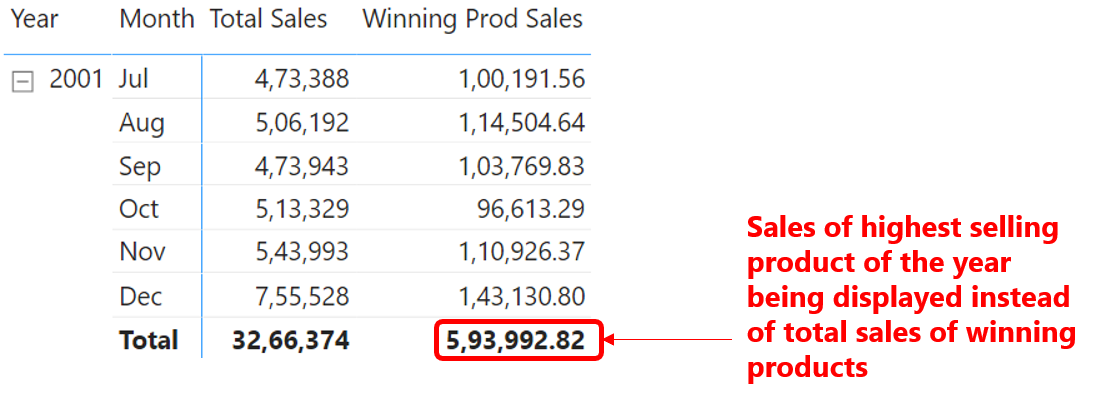
The year total shows the Sales of MAX Selling product for the entire year, however, I want to the sum of all the MAX Selling Products for each Month at the total level.
Calculating SUM of MAX Values
Here is the broad logic to solve this. I need to capture monthly max values at the total level and then sum them.
To solve this I will create a new measure as follows:
SUMof MAX Sales =
SUMX (
    ADDCOLUMNS (
        SUMMARIZE (                    -- Summary table to get monthly level granularity
            Sales,
            'Calendar'[Year],
            'Calendar'[Month]
        ),
        'MAXSales',
            MAXX (                     -- for each month calculating MAX Selling Product
                Products,
                [Total Sales]
            )
    ),
    [MAXSales]
)
Drag this measure to the pivot table.
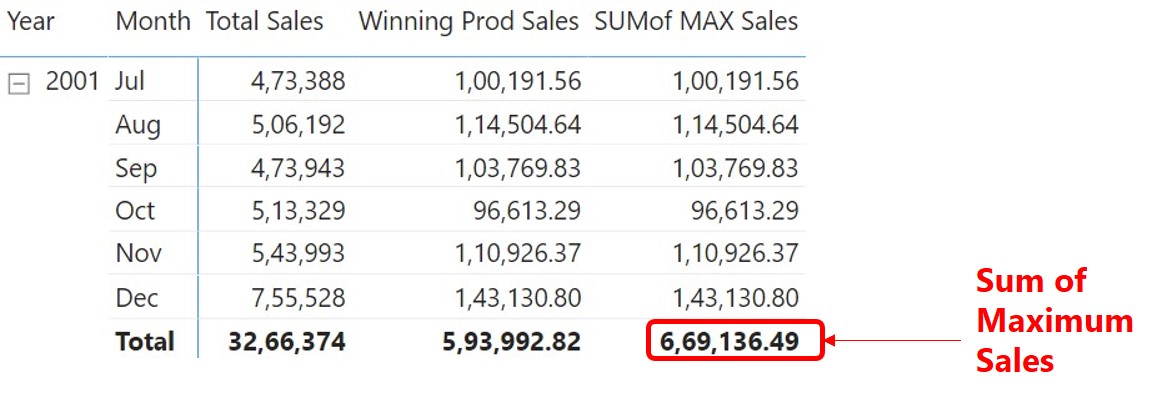
Now, the pivot table will display the SUM of MAX Values at the total level.
More on DAX