Let’s start with a joke. Relationships in Power Pivot or Power BI are far easier to create and manage than in real life..(which I guess is somewhat true)
Ain’t it funny? I know it’s not 😀 Let’s get down to some real learning
In this post I am going to explain everything about creating relationships in Power BI / Power Pivot.
- What are Relationships and the problems they solve
- How to create a relationship (in Power Pivot and in Power BI) + some common Pitfalls
- Do’s and Don’ts – from facts to look-ups
- Relationship type – one to one | one to many
- Just one active relationship
- Common Error – with duplicates
- How relationships work
#1 What are relationships and the problem they solve
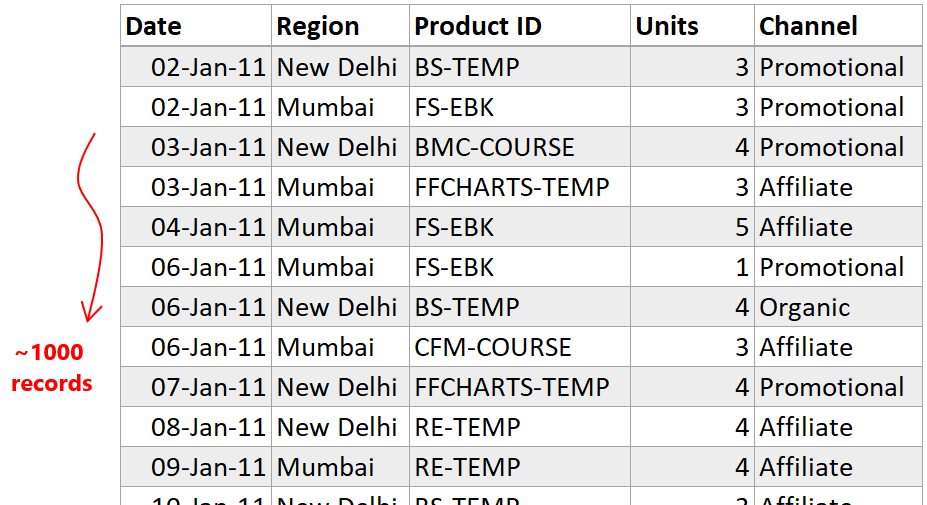
Relationships are like virtual vlookups – a vlookup without actually performing it. You’ll understand it better when you take a look at these 2 simple data sets
Sales Table – Product ID is the common column
Products Table – Product ID is the common column
Try to answer these 2 questions – (how would you answer them using excel)
- Find Total Units Sold by Product Name ?
- Find Total Units Sold by Category ?
To answer any of these using conventional excel you’ll have to write 2 vlookup formulas to get the relevant product name and category from the Products Table.
By using relationships in Power BI or Power Pivot you can solve this problem without creating lookup formulas
#2 How to create a Relationships + Pitfalls
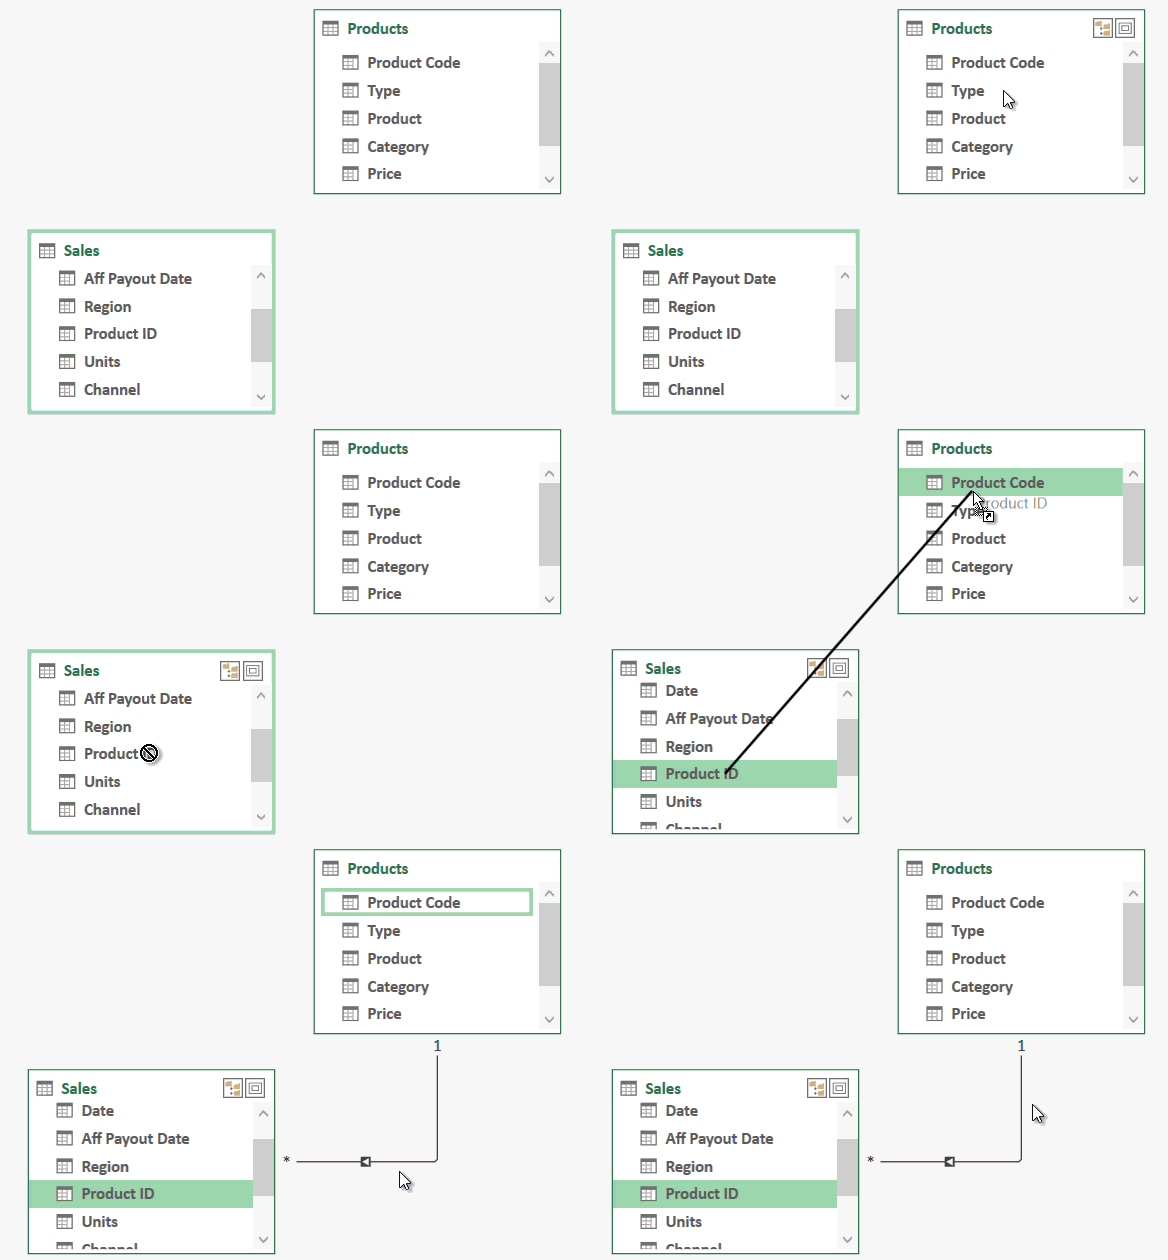
In the relationship tab of Power Pivot or Power BI simply drag the common column from the transactions table (the data-set where you thought of writing a vlookup) and link it to the common column in lookup table (source data for vlookup). Obviously no vlookup is required
Carefully note a couple of things here
- Always stretch the arrow from the transactions table to the lookup table and NOT vice-versa
- You’ll have to manually create relationships in Power Pivot but as you load data in Power BI this happens automatically. But it might NOT be always right
Relationships in Action – (how they work)
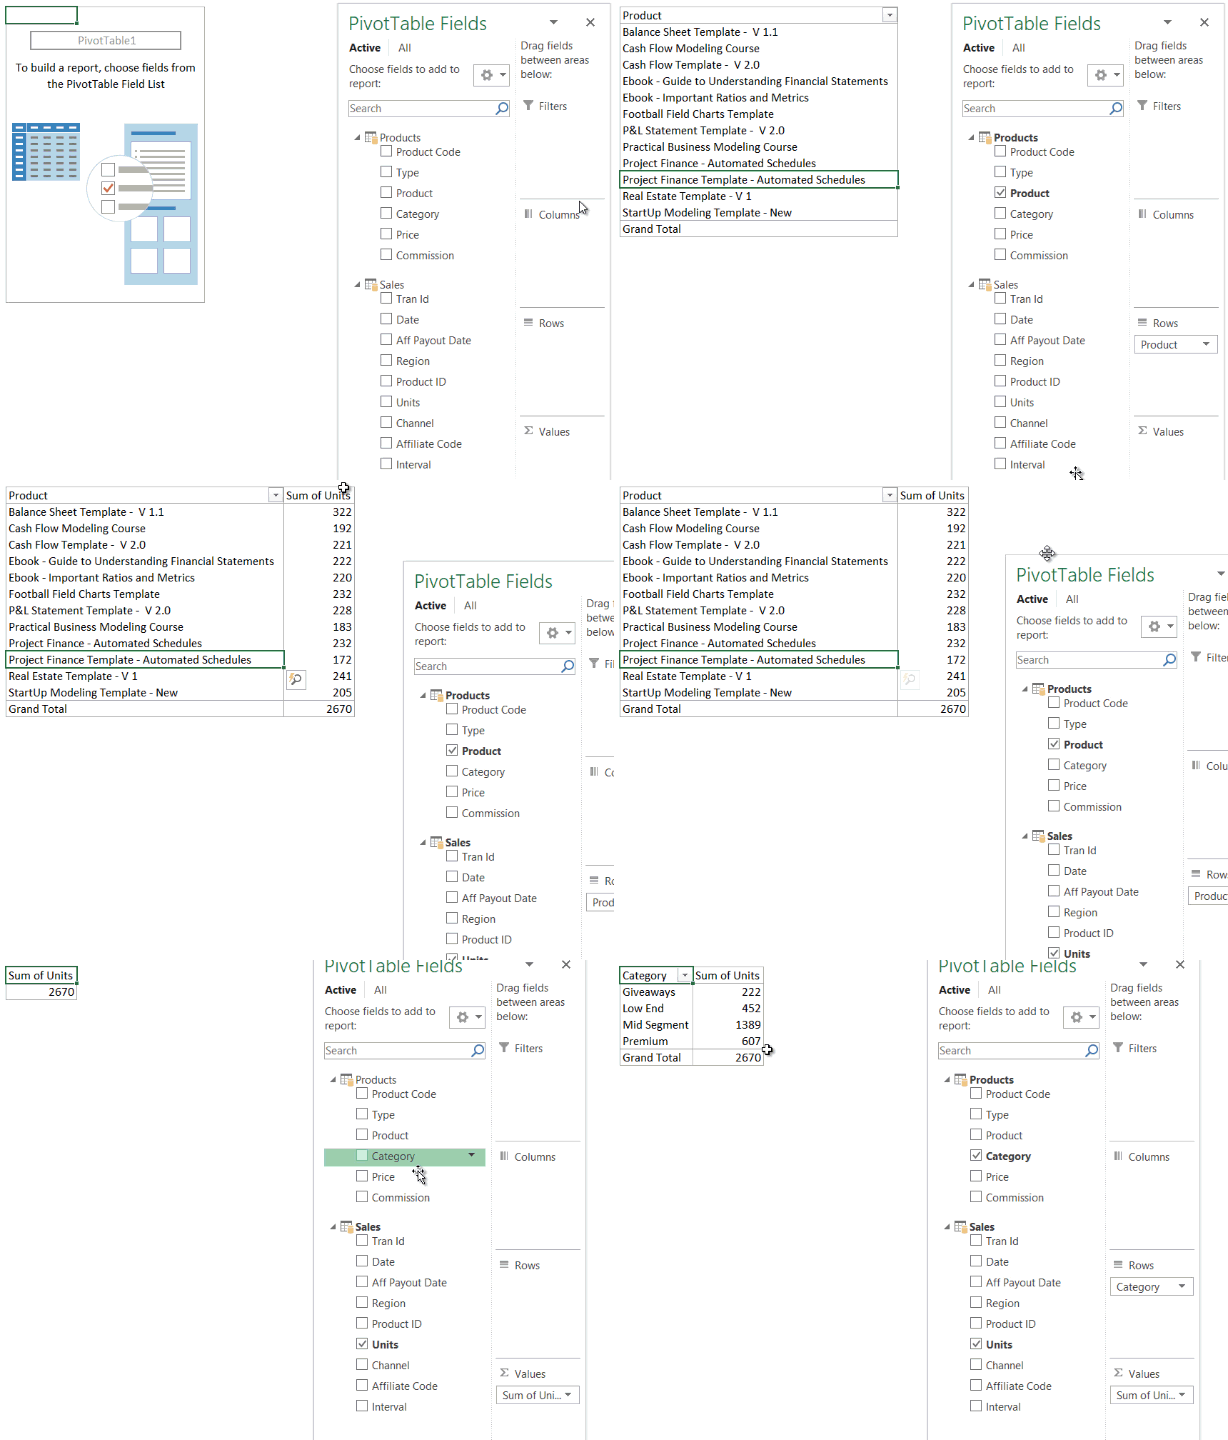
- Now when you create a Pivot Table from Power Pivot window or in Power BI
- You’ll see that you have the multiple tables displayed in Field List (this does not happen in conventional pivots)
- And you can drag any field from the Products table to slice Total Units
- If you think about it, it is pretty dope. No more vlookup
Some Common Pitfalls #1
- Always always always create the relationship from the transactions table to the lookup table and NOT the opposite way
- Since Power BI creates the relationship automatically, always recheck them manually
Some Common Pitfalls #2 – The following relationships are supported in Power Pivot and Power BI
Some Common Pitfalls #3 – At times you’ll have the need to relate one column (of the lookup table) to multiple columns (of the transactions table) Sure enough… you can do that but there can only be one active relationship between 2 tables
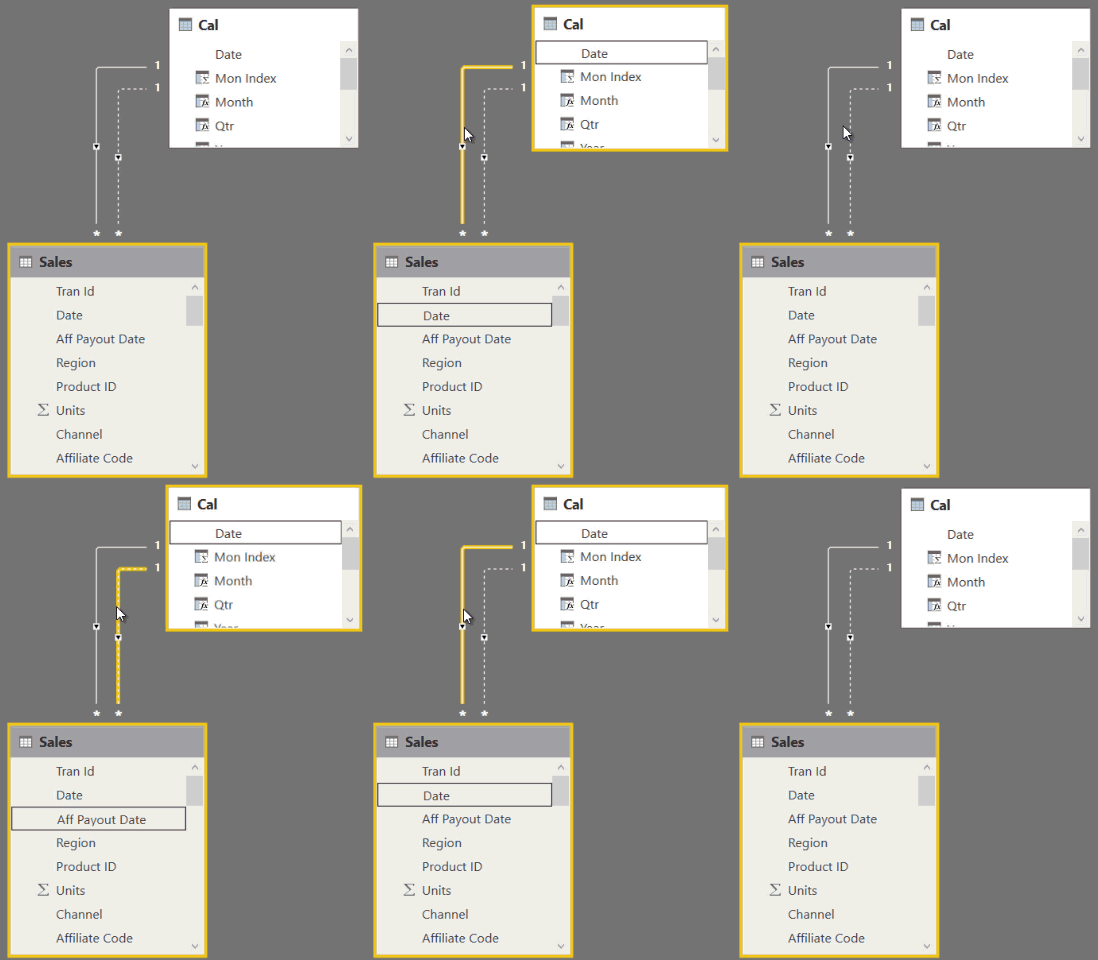
Take a look at this example with 2 date columns and 2 relationships with Calendar Table
Note that
- There are 2 date columns (sale data and affiliate payout date) for “affiliate sales”
- If you have already made a relationship between the Date (from sales) and Date (from Calendar) then
- The second relationship that you create will be inactive (with dotted line), since there can only be one active relationship
- The inactive relationship can be made active in measures using USERELATIONSHIP function
- All other measures and filter propagation will work according to the Active Relationship
Some Common Pitfalls #4 – Duplicates are not allowed in the lookup table (both in Power Pivot and in Power BI)
- You’ll get an error, if while creating the relationship there are duplicates in the lookup table
- If duplicates pop up after refreshing the data model – it would still result in an error and all measures and filter propagation would stop working
#3 How Relationships Work
The relationships always propagate the filters from lookup tables to fact/transactions table – what this means in English
- You can pick a column from products table (let’s say category) to filter total units sold (in Sales table)
- This will not happen vice-versa. For eg – you can’t take a total of all products (from products table) and try to filter it by Channel (kept in sales table)
In case you love watching over reading…
Check out some other interesting posts on PowerBI / PowerPivot
- Create a Pivot Table in Power BI
- Learning and Development Dashboard in Power BI
- Top Selling Product Analysis
- How to do a Vlookup in Power Pivot


