Have you ever used a regular item for a non regular use? Let’s say using a bangle for opening a bottle of coke or tapping a tea spoon for making noise 😆 Funny indeed but these fixes at times are pretty robust.
On a similar note, let’s take a look at how can you unusually use Data Validation drop down feature for creating ON/OFF (show/hide) switches for your Charts / Calculations
Let’s Begin with this regular Data

We have 6 product sales for the last 7 years
Now let’s create the Switches..

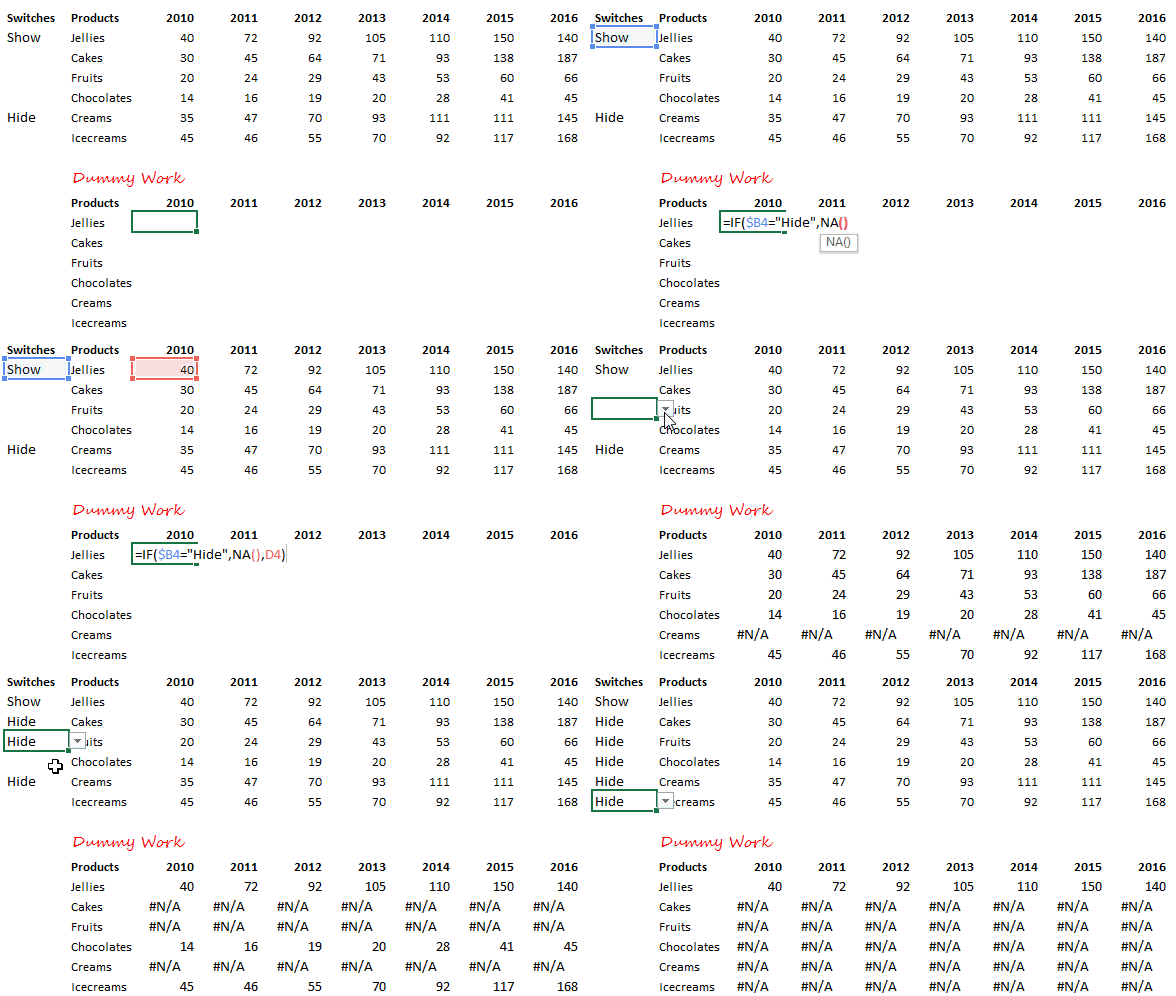
In the column prior to Products. Create a Data Validation list feature
- Select all the cells
- Go to Data Validation in the Data Tab. (Shortcut is ALT A V V)
- Choose List and in the source write ‘Show,Hide’
- Now in all the cells you have a drop down with Show and Hide
Linking the Switches to the Data..

Now that we have out switches. We might as well connect that to our data by creating some dummy calculations
- Note that I have simply copied the headers (Product names and the years)
- A simple IF formula would do the trick =IF (Switch = “Hide”, NA(), Number) The formula will show an #N/A if the switch is turned to HIDE. And for your good info, #N/A does not appear in the Chart!
- Now as soon as you change the switch you’ll see the effect rolling in your IF Calculations
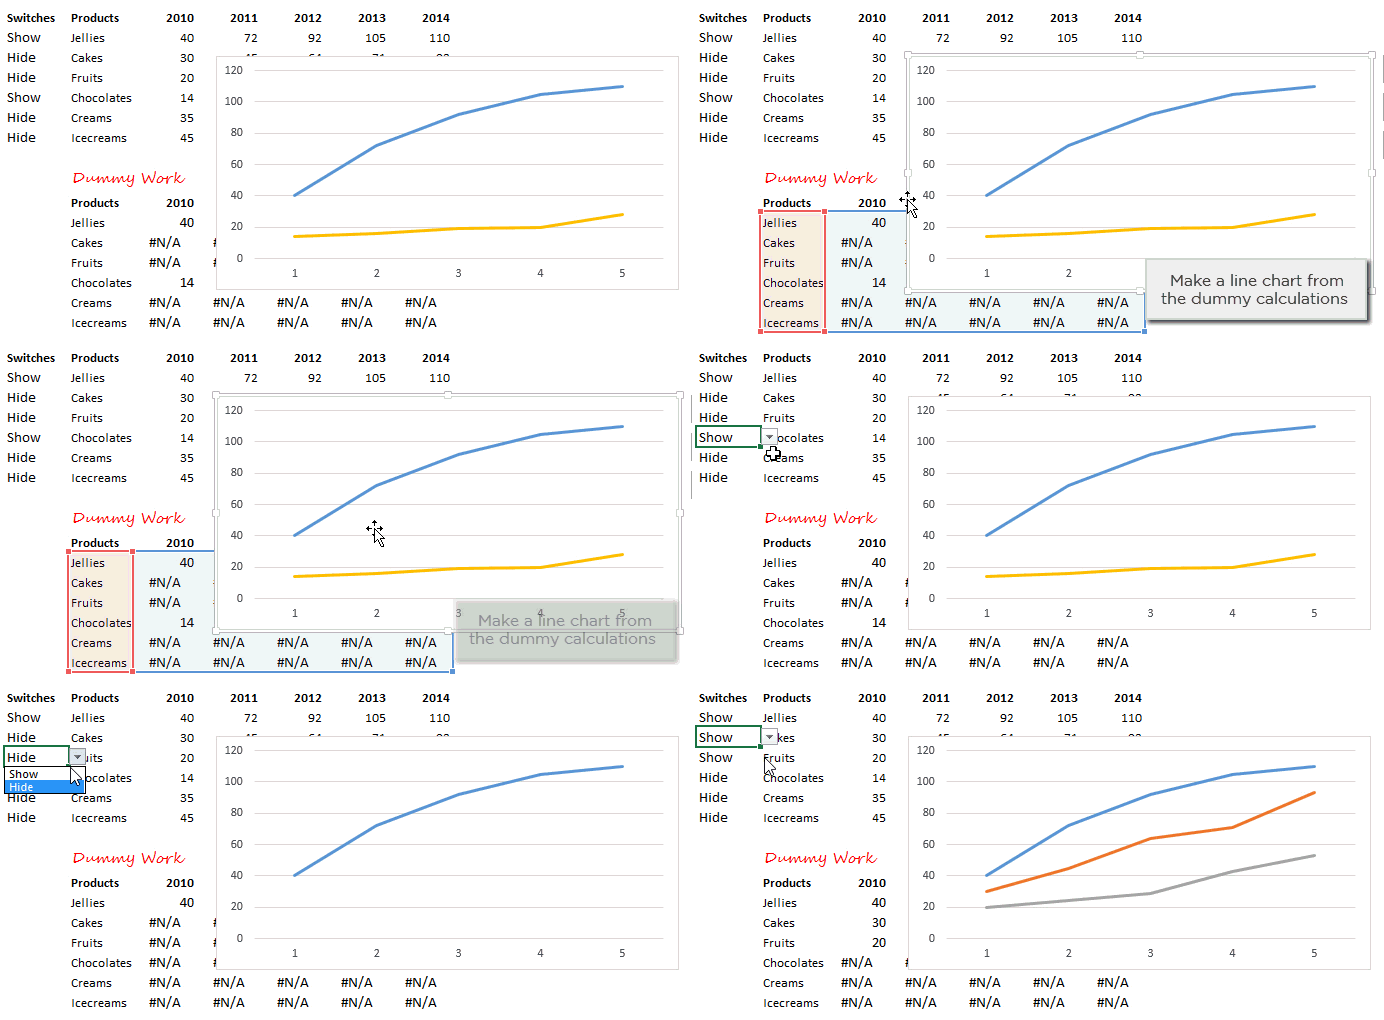
Make a Line Chart from the Dummy Calculations

- Make a Line Chart from the dummy calculations,
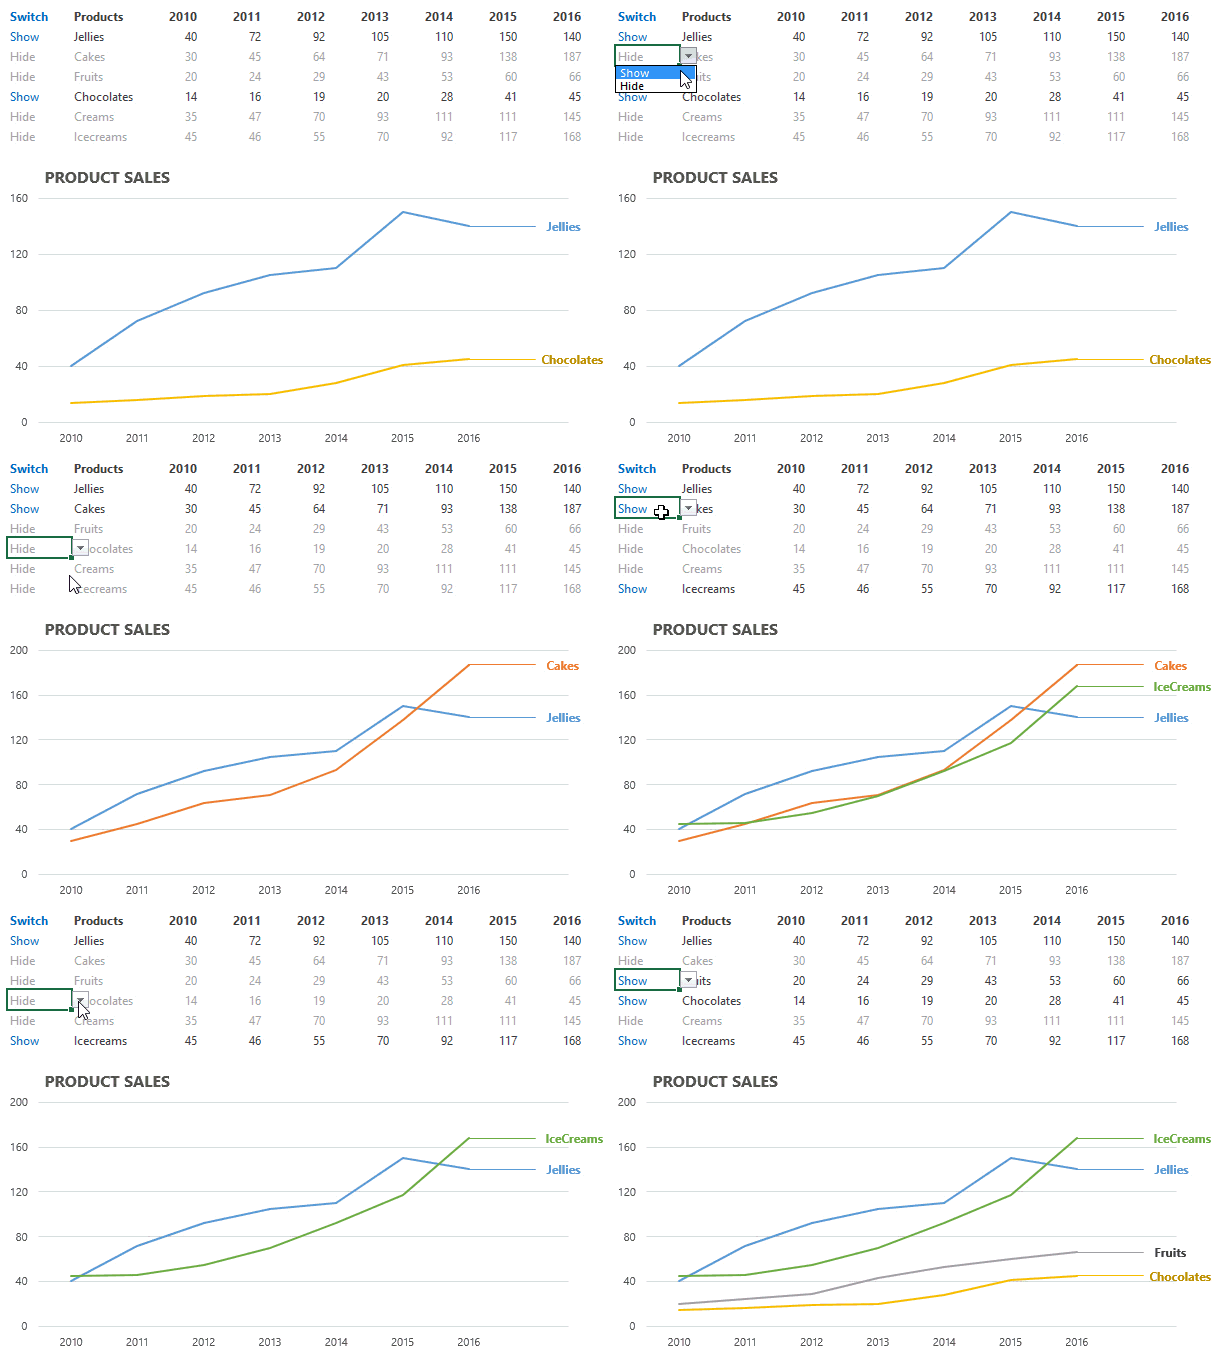
- The Chart responds to changes made in the switches
Formatting the Chart
Although our chart is ready but needs a hell lot of formatting. Here are few points for you to consider right away
- Give a title to the Chart
- Remove unnecessary borders and lines
- The horizontal axis should be linked to years
- Add the legends

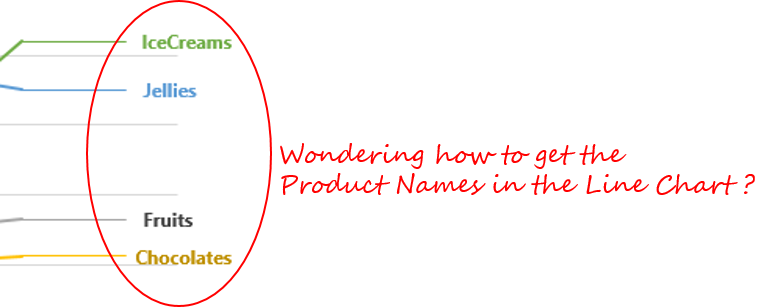
If you are wondering how did I manage to get the product names in the line chart ? Then read this – Add Direct Legends to the Line Chart
Have you tried using Data Validation as Switches?
As of now we have added a bit of dynamism to a simple line chart but you can literally use this trick where ever you want to simulate a switch like feature. It works like a charm!
Let me know
- If you are new to this then how are your going to implement this in your work or
- How have you used this before ?
Other Dynamic Charts
- Create a Check Button Chart – Very Similar to Data Validation Switches
- Timeline Chart in Excel
- DOT Chart in Excel – Interesting way to show rating data
- Funnel Chart Visualization
- Info graphic Chart Part 1
- Info graphic Chart Part 2
- Target Charts – Interesting Chart to show values against targets
- Encircle Points in a Line Chart
- Add a Total Bubble at the End of the Line Chart
