This post is an advanced application of the previously written posts on
If you have not read the above 2 posts I strongly recommend reading them before you dive into this
The Idea of this Dashboard
Recently I wrote a post on How to Make a Dashboard in 15 Mins. The objective was to make a simple, quick and an insightful dashboard using Slicers in Excel plus a few simple formulas
Think of Slicers as fancy buttons to filter your data, so essentially it is a visual extension of Filter in Excel. People loved it! But a few din’t..
The reason (problem) was Slicers in Tables work only in Excel 2013 and not earlier versions. Some people said – “Can we have this done in Excel 2007/10 ?”
I was like yeah man! Advanced Filter is the way to do this
Recommended Prior Readings
I highly recommend reading /watching these because about 90% of the learnings are drawn from these 3 posts
- Advanced Filter in Excel [reading time 10-15 mins] – If you are new to advanced Filter, you must first learn how it works and a few applications of it
- Automation of Advanced Filter [reading time 10 mins] – Once you understand Advanced Filter, the next step is to automate it using a simple VBA Code
- Make a Dashboard in 15 Mins [watching time 15 mins] – The video teaches you to set up the Dashboard using slicers and tables.
In this post, we will use the same dashboard structure but link it with the Advanced Filter instead of Slicers
Step 1) Setting up the Data and Condition Table
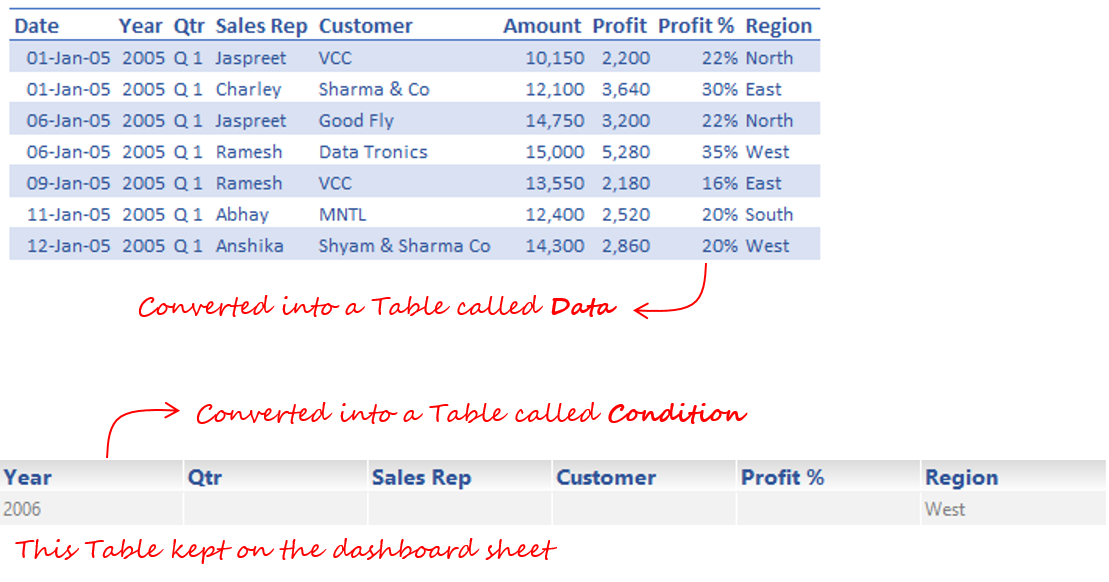
Note that
- We have converted the data into a Table named “Data”
- And the criteria into a Table named “Condition”
Step 2) Making the Charts
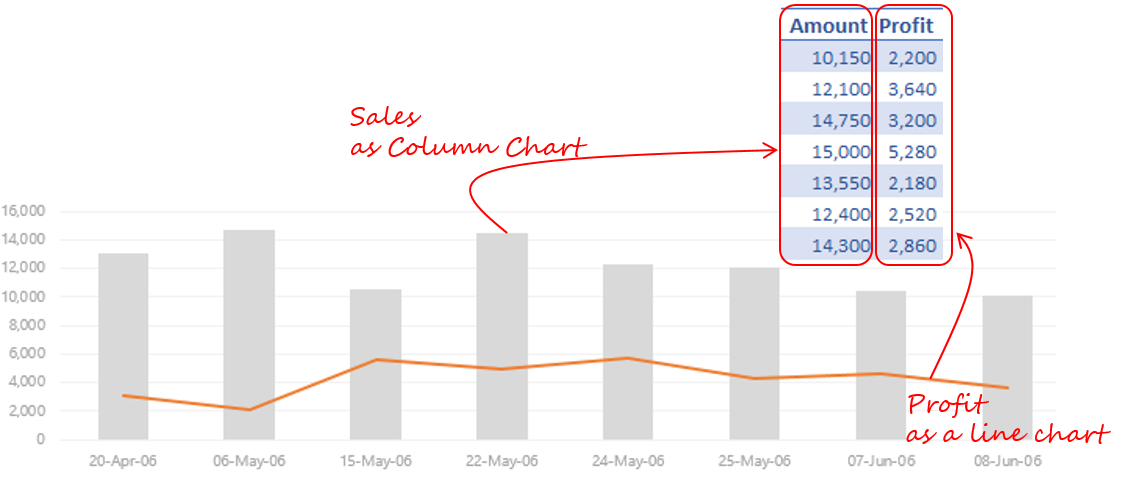
- Sales presented as a Column Chart using the Amount Column
- Profit presented as a Line Chart using the Profit Column
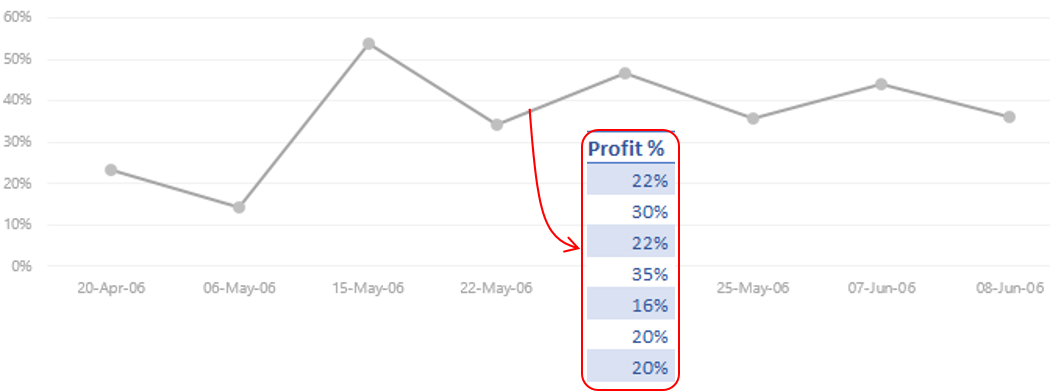
Profit % presented as a Line Chart using Profit % Column
Step 3) The VBA Macro for Automating Advanced Filter
Sub Advanced_Filter_Macro()
 Range('Data[#All]').AdvancedFilter Action:=xlFilterInPlace, CriteriaRange:= _
 Range('Condition[#All]'), Unique:=False
End Sub
- Write this code down in a VB Window
- Note the blue text can be edited to fit your case
Step 4) Link the Macro to a Button
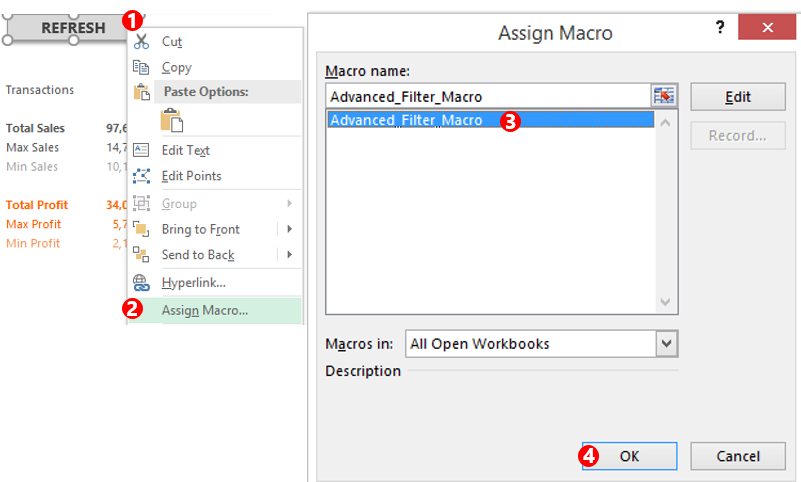
- Create a Button and right click on that
- Go to assign macro
- Link the Macro that we have just pasted in the VBA Window
- OK
Boom! Our Dashboard is Done
DOWNLOAD THE FINISHED ADVANCED FITLER DASHBOARD FROM BELOW. This file contains a Macro, activate it before playing with it
This is how the Dashboard works !
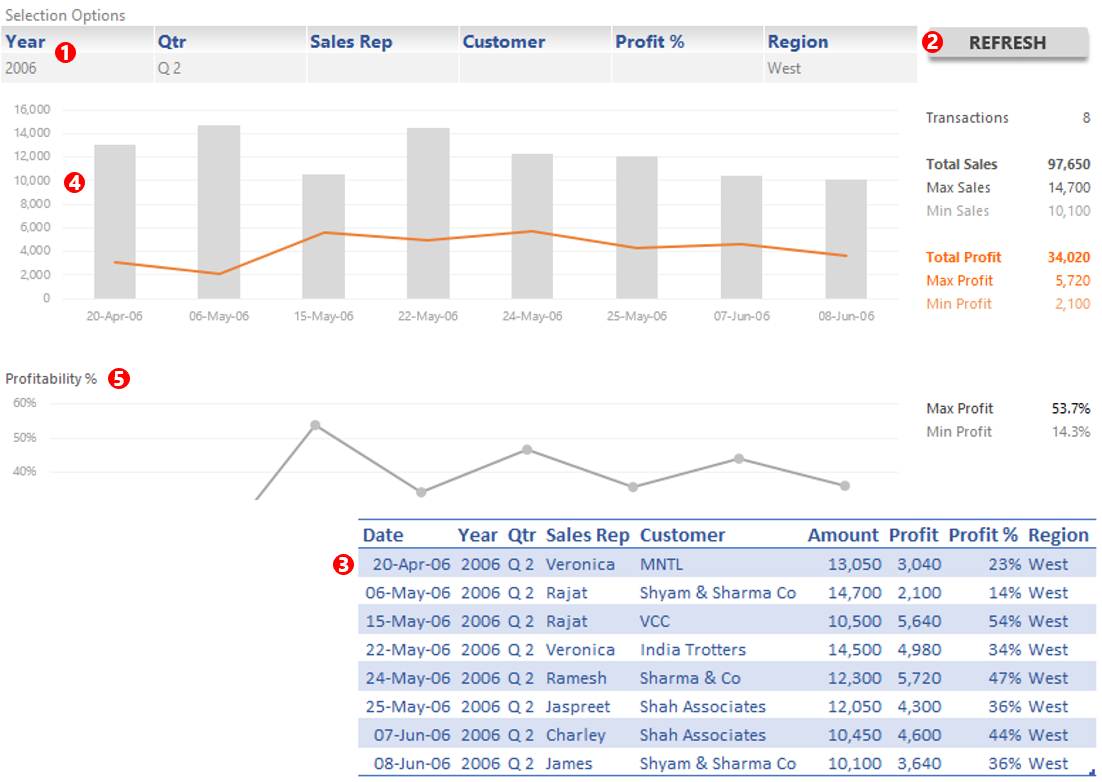
- When you enter filter Criteria in the Condition Table
- And Click on Refresh button which is linked to the Macro
- The macro runs and the Data gets filtered by using Advanced Filter
- The Charts update automatically to show only visible cells (and not the hidden cells)
If you are more of a video learner, here is a quick video explaining the step by step process to make this dashboard
Next time don’t think of applying a simple filter, instead work 5 mins extra and make an Advanced Filter Dashboard and send it to your boss! He will fall right off his chair. I promise!! 😀
Simple Charts & Dashboards
- Use Drop Downs to make Chart Switches
- Check Button Chart
- Convert a Data Dump into a Visualization
- Funnel Chart Visualization
More Advanced Dashboards
- Republic Day Visualization
- 30 Day Challenge Dashboard
- Bubble Chart Matrix with Scrollbars (Videos)
- Economist Chart Rework