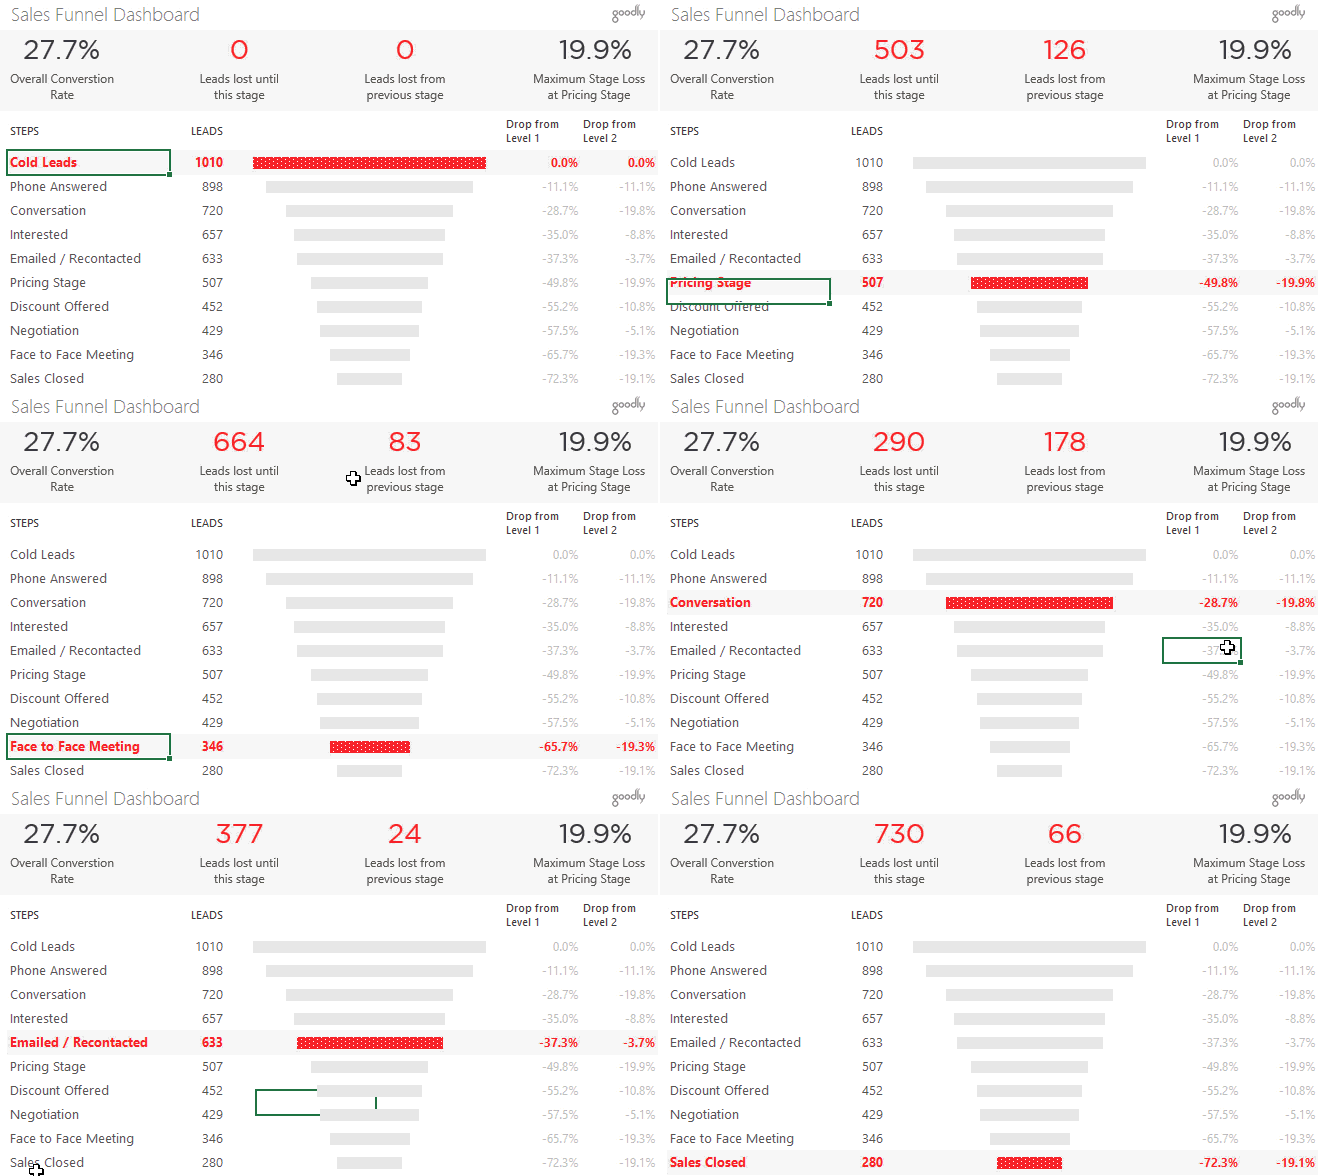
I had been toying around with the idea of creating a nice and meaningful funnel chart and I am glad it is finally here. Although in this example I have picked up a random sales data but this chart can be used in any scenario where you have funnelled stages!
Eg. Sales Funnel Chart (like the one above), Interview Process Funnel Chart, Call Drop Funnel (for a call center)
It not the usual funnel chart that you see around and to make it dynamic (and sexy) I have used some nifty techniques. Let’s check them out..
Since there are many techniques working together in this chart, to help you understand better I am going to make this a 3 staged tutorial for you
Watch the Video on Funnel Charts
Notes and Links
- Formulas Used – INDEX, MATCH
- Chart Cleaning Techniques
- Dynamic Text Boxes
- Be sure to enable macros before toying around with this file
Advanced Dashboard Resources
- How to make your dashboards more insightful
- Improve the look and feel of your dashboards (pdf)
- Flight Schedule Dashboard
- RIO Olympics Visualization
- 30 Day Challenge Dashboard
