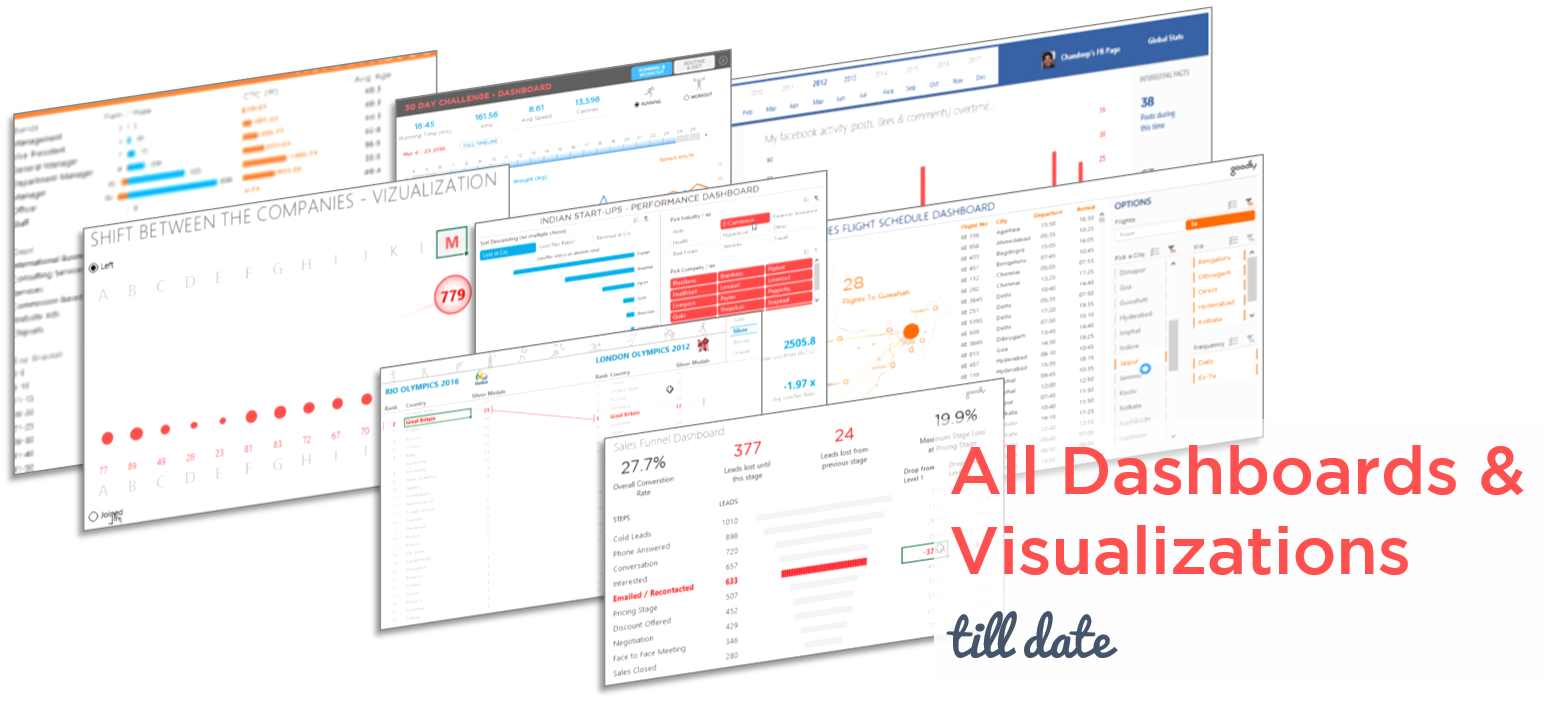
In the last few years of Blogging I have made quite a few Dashboards and Visualizations. In this post I’ll put them together so that you can access them at a single place
DOWNLOAD ALL DASHBOARDS AND VISUALIZATIONS
– Just to make things easy you can download all of them in one shot
Dashboards & Visualizations
Along with comprehensive Dashboards I have also included some really cool standalone charts and visualizations. If you want to scroll through the list, be my guest. Most of them have videos and tutorials as well
- Facebook Dashboard in Excel
- Sales Funnel Chart in Excel
- Improve the Look and Feel of your Dashboard – Guide
- 80-20 Pareto Analysis Chart in Excel
- Flight Schedule Dashboard
- Indian Tech Startup Performance Dashboard
- Excel World Champ Visualization
- Dashboard using Advanced Filter
- RIO Olympics Visualization
- Make a Dashboard in 15 Mins
- Cost Structure Visualization – Dashboard Contest
- Shift Between Companies Visualization
- Dot Chart Visualization
- Funnel Chart Visualization
- Highlighting Parts of a Line Chart Visualization
- 30 Day Challenge Dashboard
- Infographic Chart 1
- Infographic Chart 2
- Target Charts in Excel
- Republic Day Visualization
- Highlighting Parts of a Stacked Chart
- Bubble Chart Matrix with Scrollbars
- Blogging Dashboard
- Stock Ticker Chart
- Worlds Biggest Economies – Economist Chart Reworked
- A Simple Sales Dashboard
- Analogue Timer Visualization
- Human Resource Dashboard
- Converting Data Dump into a Visualization
- Map Chart for Plotting Cities
- Customized Scrollbar In Excel
Leave a comment and let me know which ones you liked the most. Cheers and hope you enjoy this